
The zones you would draw, found for you.
Five kinds of area and level, found on closed bars and drawn with their own colours: minimum and maximum wick levels, compression zones, fair value gaps and zones you define yourself. Broken and unbroken look different, and each kind can speak up when it is hit.
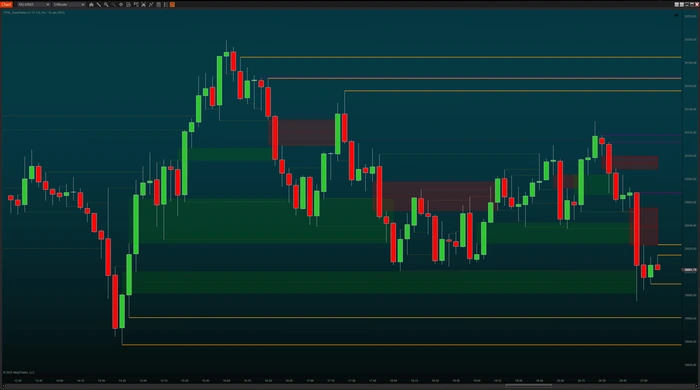
What it puts on your chart
Support and resistance are drawn by hand, and drawing by hand has two failure modes. You miss levels, because the move happened while you were looking somewhere else. And you keep levels, because redrawing a chart after every break is work nobody does consistently at half past three in the afternoon.
ZoneFinder applies your definitions to every closed bar instead. Wicks that stay under a length or reach one become horizontal levels. Two bars sitting tightly together become a compression zone. A range that price crossed without trading in it becomes a fair value gap. And whatever else you can express in four OHLC conditions becomes a config zone. All of them are classified as support or resistance, all of them are watched, and the moment price breaks one, its appearance changes.
That last part is what makes 910 settings reasonable rather than excessive. Five detection types, four states each, every state with its own colour, line style, width, opacity and label, plus its own sound and its own notification. Version 3.7.0.0 is the largest of the tools in this range, and almost all of it exists so a chart carrying forty levels still reads as a chart.
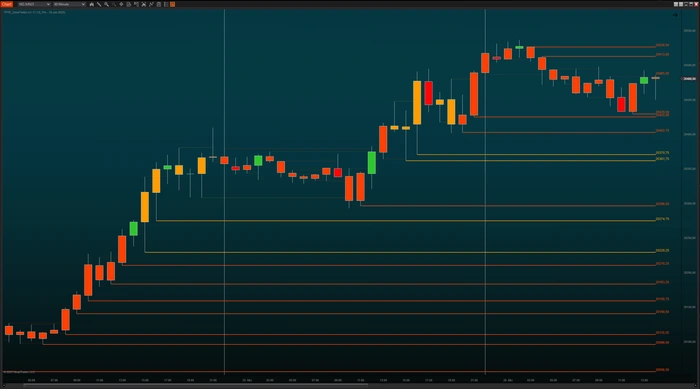
Wick levels, both directions, both thresholds
A wick that stands out says something about where price was rejected. ZoneFinder finds those bars two ways at once: Max Wick looks for wicks that do not exceed a length you set, Min Wick for wicks that reach one. Both are configured separately, both draw a horizontal line from the end of the wick, and both distinguish broken from unbroken. Bars that qualify can be coloured as well, so the reason for the line stays visible.
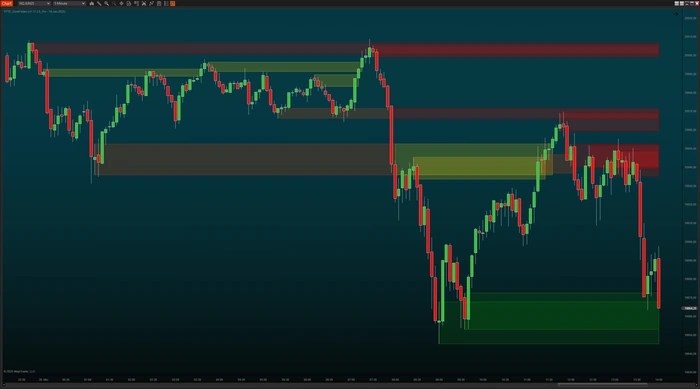
Three kinds of zone, each classified as support or resistance
A compression zone comes from two closed bars whose ranges sit tightly together, the picture of a market that has stopped moving. A fair value gap is the opposite, a price range that was crossed so quickly that barely anything traded in it. A config zone is whatever you define: up to four OHLC conditions joined by your own group logic. All three are classified as support, as resistance, as both or as neither, and all three have their own look for broken and unbroken.
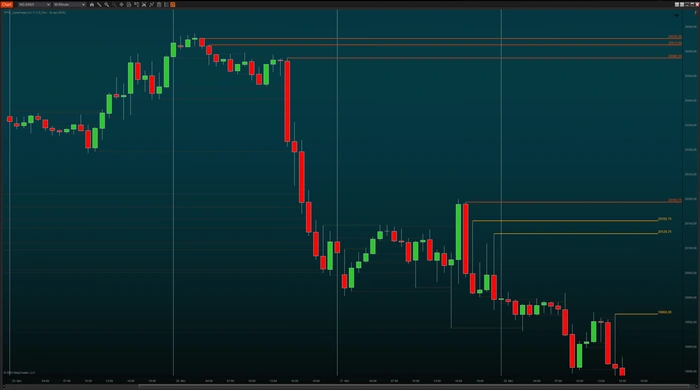
What is still standing, and what is not
Every level and every zone exists in two states, and both get their own colour, line style, width and opacity. That is the difference between a chart with forty lines on it and a chart you can read: the ones that still matter are visible at a glance, and the ones that have already been taken out can be toned down or hidden entirely.
What you can change.
910 settings in version 3.7.0.0, read out of the installed indicator. The list below is what they are for.
Wick levels
- Max Wick: wicks that do not exceed a length you set
- Min Wick: wicks that reach a length you set
- Both configured separately, with their own thresholds and wick location rule
- Horizontal line from the end of the wick, with the price as a label
- Broken and unbroken drawn differently, for highs and lows separately
- Qualifying bars can be coloured
Zones
- Compression zone: two closed bars whose ranges sit tightly together
- Fair value gap: a price range crossed without meaningful trade, with a minimum size in ticks
- Config zone: up to four OHLC conditions joined by your own group logic
- Each zone classified as support, resistance, both or neither
- Four states per zone type, long and short, broken and unbroken
- Break rules and visibility set per zone type
Bar sequence builder
- Describes a sequence over four phases, first bar, second bar, the bars between and the closing bar
- Up to six conditions per phase, joined by group logic
- Evaluated on closed bars only
- Own marker with shape, size, colour and offset
- Origin line back to the bar the sequence started on
Alerts and notification
- Own sound card per detection type, with its own .wav file and spoken text
- Trigger on touch or after the bar closes
- Spoken alerts with language, voice, rate and volume set once for the whole tool
- Pop-up notification per type, with adjustable display time
- Email notification for connection trouble
In the chart
- Realtime Settings window, opened from a button in the chart toolbar
- Levels and zones can be carried to other charts with the ZoneFinder Duplicator
- Drawing order against other indicators, set by Z value
- Max Days To Load caps how far back the calculation reaches
- Logging to the NinjaScript output window, the Control Center log tab, or a file of its own
Five kinds of finding, each with its own everything
This is the largest of the Sidi indicators by some distance. Each detection type carries its own calculation card, its own appearance for four states, its own labels, its own sound and its own notification.
What it finds
- Max Wick levels
- Min Wick levels
- Compression zones
- Fair value gaps
- Config zones, defined by you
- Bar sequences, described over four phases
What you get per type
- Own calculation card with its own thresholds
- Four states, long and short, broken and unbroken
- Own colour, line style, width and opacity per state
- Text label with the price
- Own .wav file and spoken text
- Own pop-up notification, plus email for connection trouble
Nine hundred settings, and you still change them live
A tool this size would be unusable if every adjustment cost a chart reload. ZoneFinder has its own Realtime Settings window, opened from a button in the chart toolbar, and colours, line styles, opacity, labels and visibility modes change in the chart as you set them. The window saves, loads and resets complete presets from its bottom bar, which is how a configuration this large becomes portable between instruments.
A few fields change what is calculated rather than how it is drawn, and those still ask for a chart reload (F5). Everything visual answers immediately.
Pick your licence.
Every plan includes free updates. Secure checkout handled by Freemius.
Two versions, one licence model
ZoneFinder draws and watches the levels and zones. ZoneFinder Pro adds the detection layer on top: markers when a bar breaks a wick level with its body, or touches or closes inside a zone, and an interface that hands those detections to other NinjaScript components. Both are licensed the same way.
Before you install.
Q · 01What is the difference between ZoneFinder and ZoneFinder Pro?+
Q · 02What counts as a compression zone?+
Q · 03What is a config zone for?+
Q · 04What does the bar sequence builder do?+
Q · 05Can I show the same zones on a second chart?+
Q · 06Which NinjaTrader version does it need?+
Q · 07What do I get in the free demo?+
Read more
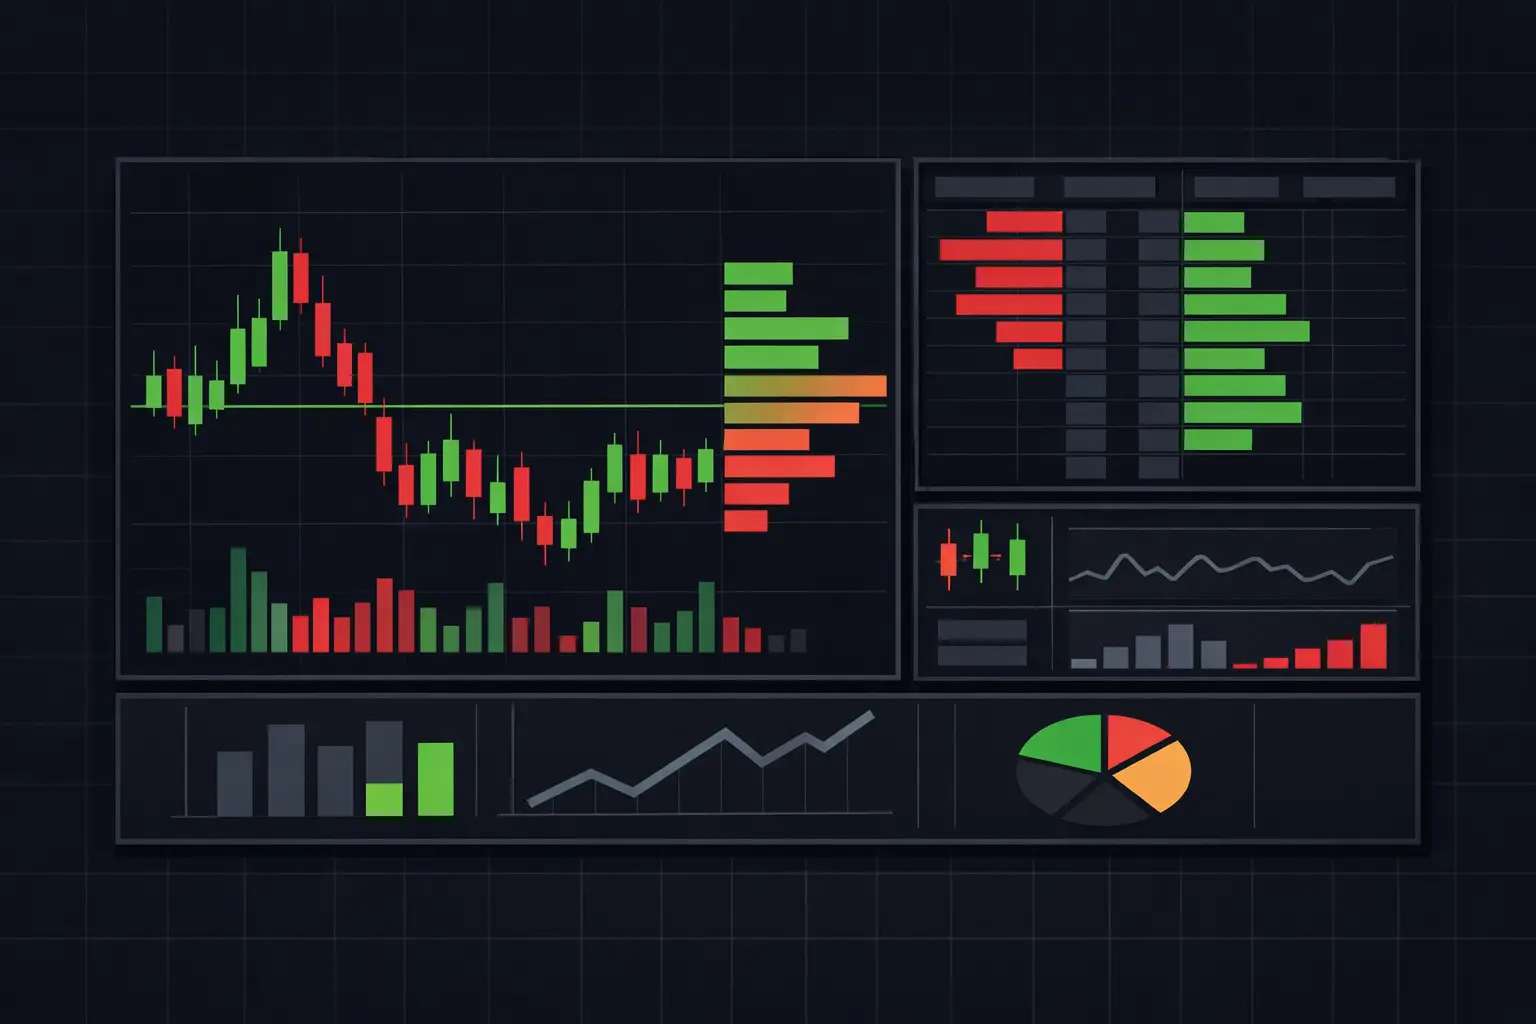
Naked VPOC Trading Strategy for Futures
Map unfinished auction references with a naked VPOC trading strategy for futures, using footprint, delta, imbalances, and session context in real time.
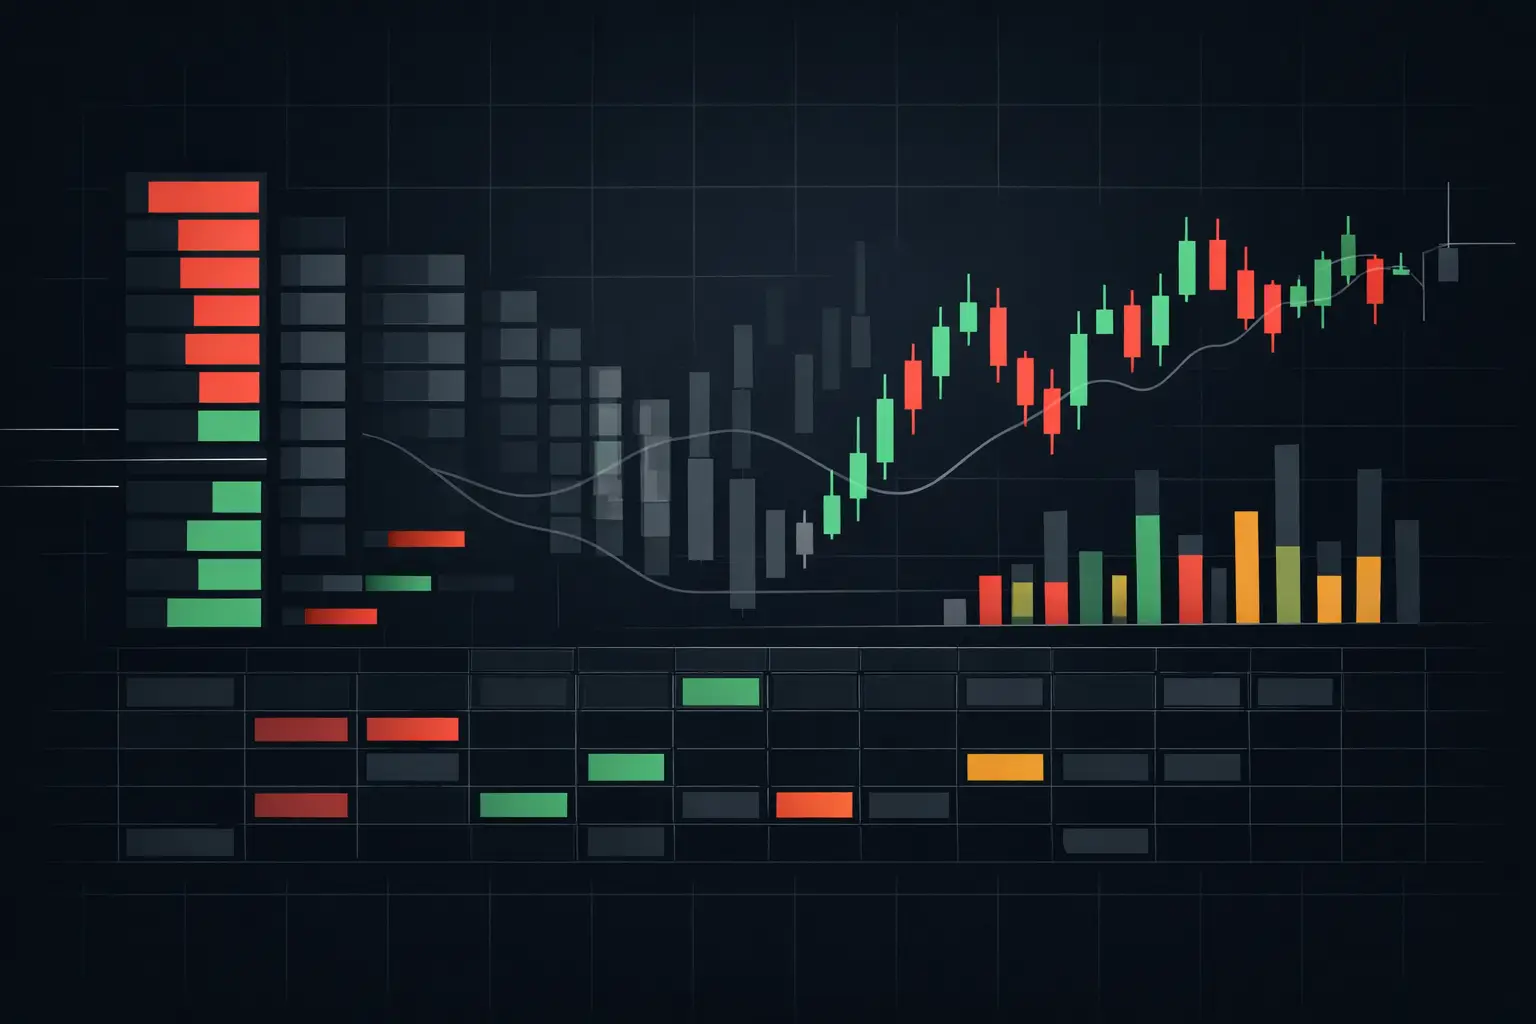
How Unfinished Auction Order Flow Reappears
Unfinished auction order flow shows where the previous auction stopped short. Read unfinished extremes with footprint, delta, VPOC, and session context.
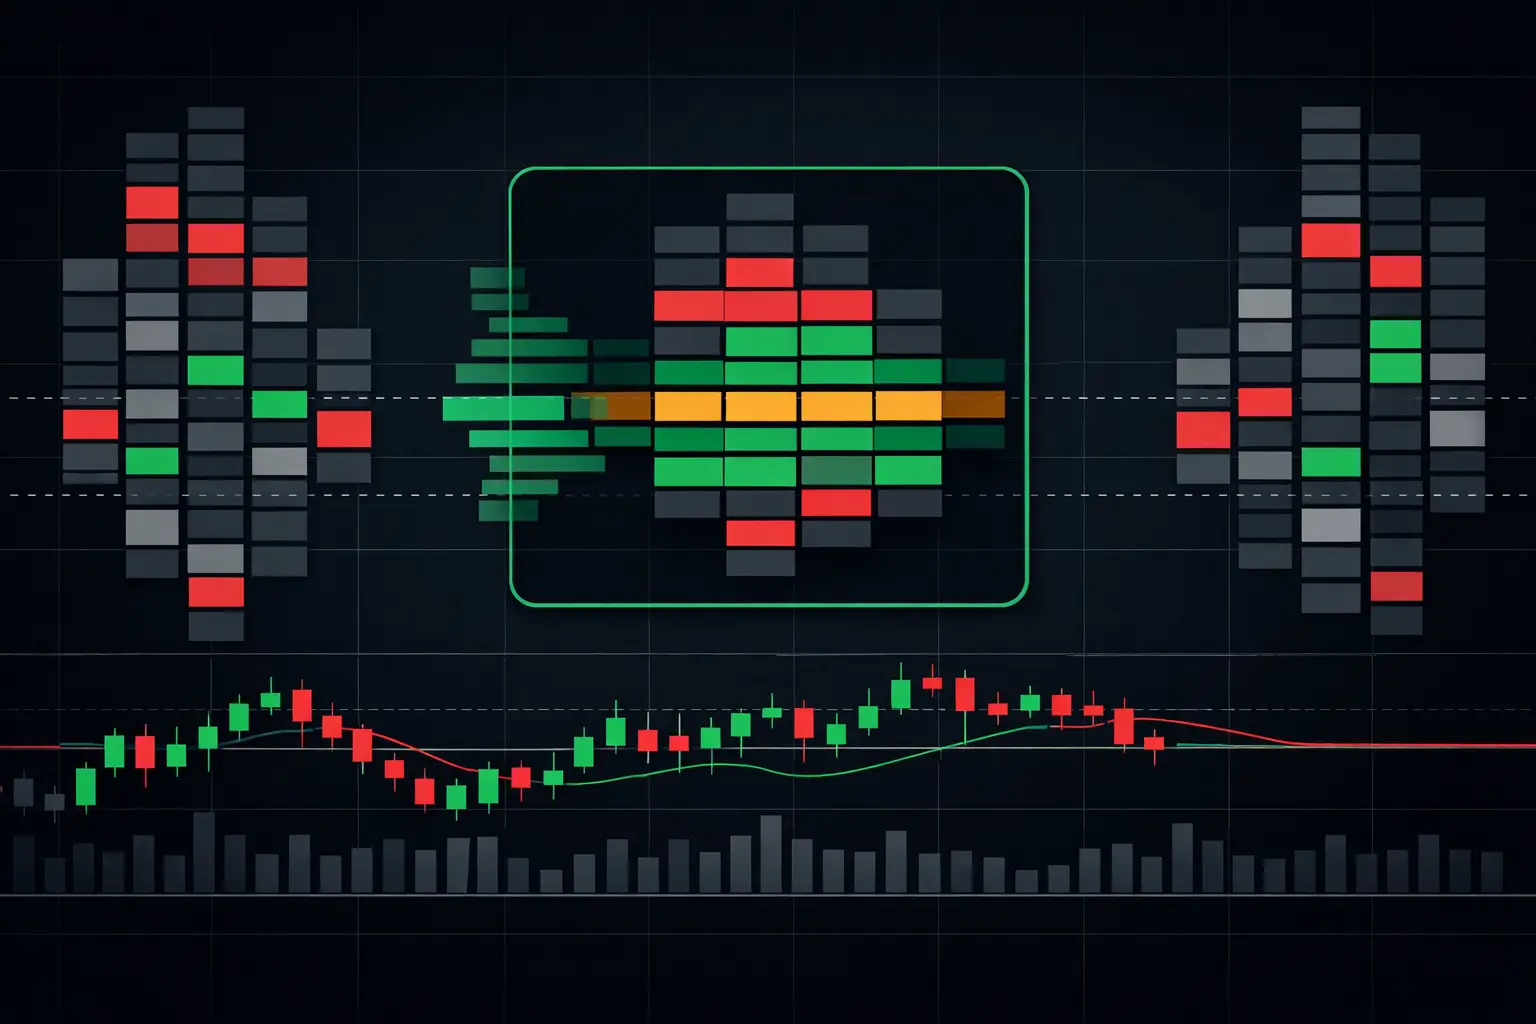
Value Area Migration Trading on Footprint Charts
Value area migration trading shows when accepted price shifts. Read VPOC, delta, imbalances, and profile development with footprint precision at speed.
See it on your own chart.
TPTE ZoneFinder is unlocked in the free 14-day demo, together with every other Sidi tool for NinjaTrader 8.
Start free 14-day demo → All tools and prices