
Naked VPOC Trading Strategy for Futures
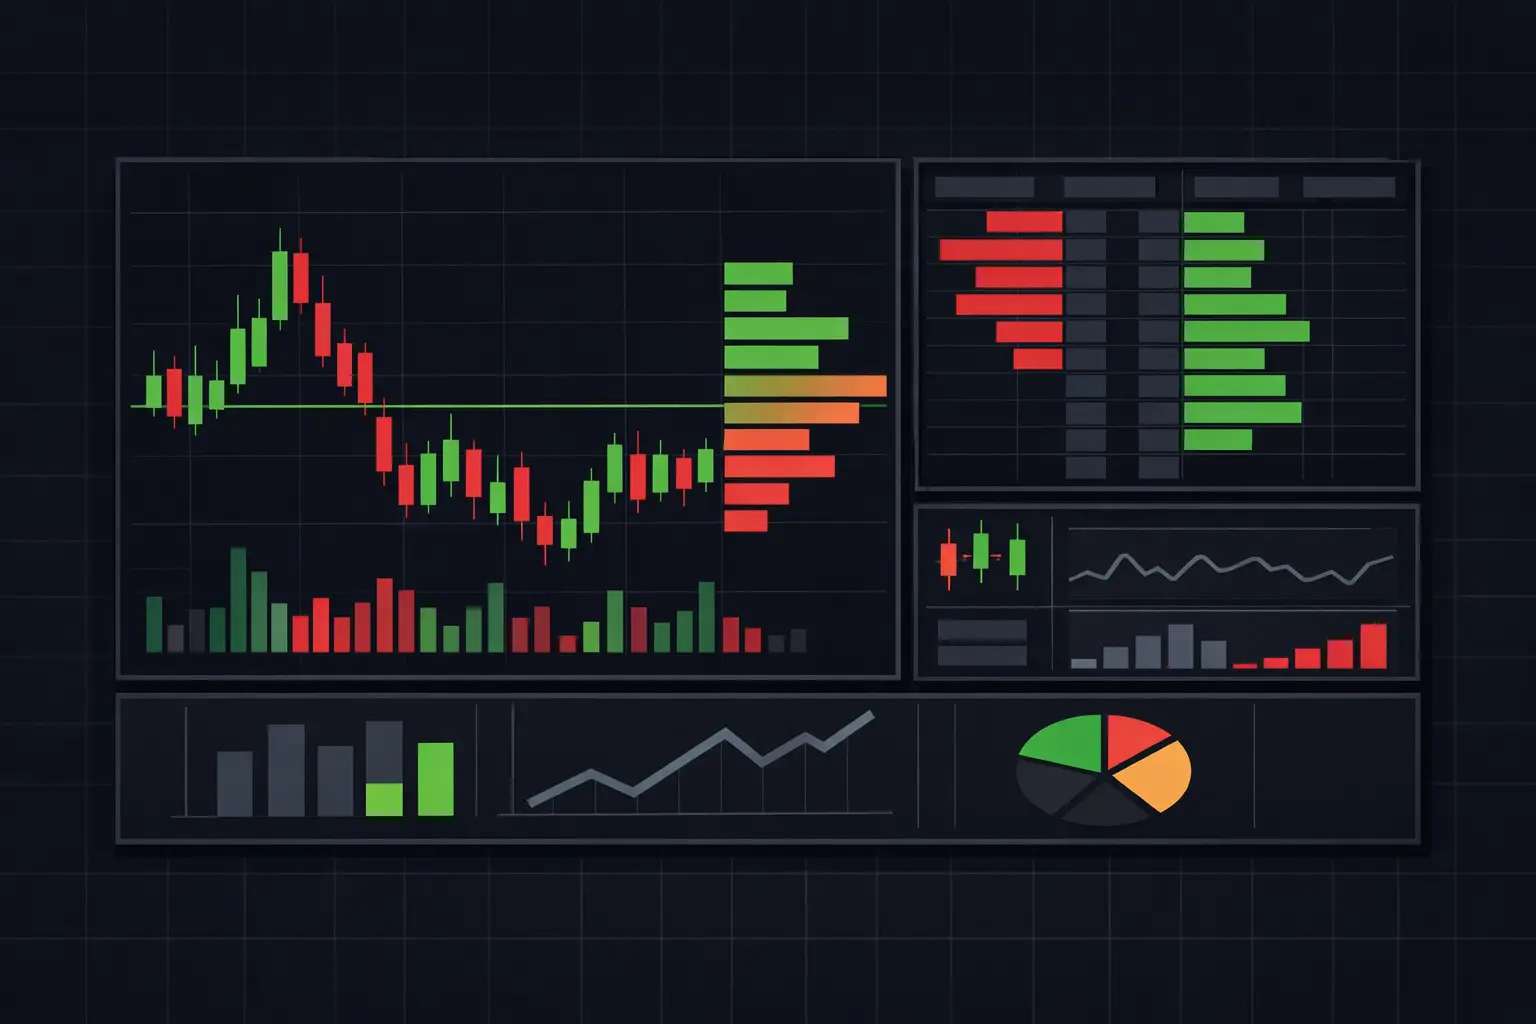
A naked VPOC trading strategy for futures starts with a simple auction fact: a high-volume price can remain unresolved after its session ends. Most traders see a horizontal level and assume it carries meaning on its own. The useful information is not the line. It is the prior auction that built volume there, the time since price last interacted with it, and the order flow displayed when the market reaches it again.
VPOC is the price with the greatest traded volume within a defined profile. It may be calculated across the regular trading session, the full electronic session, a custom composite, or another fixed range. A naked VPOC is a completed profile's VPOC that has not been revisited by subsequent price action. It is an unfinished reference, not a forecast and not a standalone chart event.
Naked VPOC Trading Strategy for Futures
The framework is best treated as a method for organizing auction references. First, mark the completed VPOC. Then extend it only until the first later interaction. Finally, inspect the revisit through footprint data, delta, volume distribution, and the surrounding profile structure.
That sequence matters. A level without its source profile is stripped of context. A VPOC created during a narrow, balanced session represents a different auction condition from one created during a directional session with volume building late in the range. Both can be naked. They should not be read as identical references.
A clean chart separates developing VPOC from completed naked VPOC. The developing VPOC can migrate throughout the session as volume accumulates. It does not become a naked reference until the profile period is closed. Mixing these two states is one of the fastest ways to clutter a chart and misread the auction.
Define the session before marking anything
For index futures, the session definition determines the level. A regular trading hours profile can produce a VPOC that differs materially from the full electronic session VPOC. Neither calculation is inherently superior. They describe different participation windows.
Use one definition consistently when studying the behavior of naked levels. If the chart projects regular-session VPOCs, do not casually compare their interaction with overnight VPOCs as though they are interchangeable. The profile boundaries, rollover handling, and data granularity must remain stable. Precision begins before the first horizontal line is drawn.
The same rule applies to composite profiles. A multi-session VPOC is not simply a larger version of a daily VPOC. It represents volume acceptance over a longer auction period and should be visually distinguished from single-session references. Separate colors, line styles, or profile columns keep the hierarchy visible when several references sit near one another.
Qualify the source auction
Before studying a revisit, inspect how the VPOC formed. Did volume concentrate near the center of a balanced distribution? Did the VPOC migrate progressively as price auctioned higher or lower? Was it established during a late-session rotation after an extended move? These details frame the reference.
A VPOC near a session extreme can indicate that substantial two-sided activity developed at the edge of the range. A VPOC centered in a broad distribution often represents a more established area of acceptance. The chart is not assigning intent to participants. It is showing where business was actually conducted and how that volume was distributed.
Also compare the VPOC to value area, prior highs and lows, opening structure, and nearby low-volume areas. A naked VPOC isolated in open auction space has a different visual role from one embedded inside overlapping value. The reference becomes more useful when the surrounding profile explains whether price is approaching an accepted area, a thin zone, or another unfinished reference.
Read the Revisit Through Footprint Data
The first interaction with a naked VPOC is where conventional candles become incomplete. A candle can show a touch and a close. It cannot show whether aggressive buyers lifted offers into passive supply, whether sellers hit bids without extending lower, or whether volume accelerated at the exact price level.
A footprint chart resolves that detail at each price. When price reaches the projected VPOC, inspect bid volume, ask volume, delta, total volume, trade count, and diagonal imbalances around the reference. The question is not whether the line was touched. The question is how the auction behaved at and through the line.
Acceptance is a process, not a single print
Acceptance is visible when activity builds around the VPOC and price continues to transact on both sides of it. Volume may accumulate at adjacent prices, the developing VPOC may begin to form nearby, and the profile can widen around the area. This is an auction observation, not a label applied from one bar.
Rejection has a different footprint. Price can probe the VPOC, transact heavily, and then fail to sustain activity beyond the area. Absorption may appear when aggressive volume repeatedly meets passive liquidity with limited price progress. Exhaustion can appear when the final push into a level prints diminished participation after an earlier expansion.
Delta adds another layer, but it should never be isolated from price movement. Strong positive delta at a VPOC does not automatically mean price is being accepted higher. If aggressive buying is met by large resting liquidity and price stops advancing, the footprint tells a different story than delta alone. The same applies to negative delta at a level that does not extend lower.
Stacked diagonal imbalances are particularly useful for locating concentrated aggression around the revisit. A diagonal buy imbalance compares ask volume at one price with bid volume one tick below. A diagonal sell imbalance compares bid volume with ask volume one tick above. When several qualifying imbalances stack through adjacent prices, they show where aggression concentrated. Their location relative to the naked VPOC, value edge, and profile shape matters more than their mere presence.
Configure the Chart for Fast Decisions
A naked VPOC workflow needs to remain readable when the tape accelerates. Projecting every historical VPOC indefinitely produces a dense field of lines with no hierarchy. Limit the display to a defined lookback period, remove a level after its first valid revisit, and differentiate references by profile type.
On NinjaTrader 8, configure the footprint display so price-level information can be read without shifting focus across multiple windows. Bid x ask, volume, delta, and imbalance views can each answer a different question. The correct layout depends on whether the trader is studying absorption, aggressive participation, or profile migration, but the reference line should remain visible in every view.
SidiFootprint supports independent profile columns, allowing a session profile and a separate contextual profile to remain on the same chart. One column can show the active session's developing auction while another preserves the prior session reference structure. This avoids the common problem of switching studies just as price reaches a level that requires attention.
Color rules should communicate state, not decoration. Use one color for active naked VPOCs, another for touched or retired levels, and a separate treatment for developing VPOC. If delta or imbalances are colorized, make sure their thresholds are calibrated to the instrument's normal pace. A threshold that is too low floods the chart; one that is too high hides the participation that matters at a narrow reference.
Text-to-speech or visual alerts can be configured around a projected VPOC, but the alert should call attention to location only. The footprint and profile still provide the interpretation. This preserves control over the chart rather than replacing market reading with an automated label.
Common Errors That Distort Naked VPOC Analysis
The most common error is treating all VPOCs as equal. A daily RTH VPOC, an overnight VPOC, and a multi-session composite VPOC have different sources and should be identified as such. The second is extending levels from incomplete profiles, which confuses developing volume migration with a finished auction reference.
Another error is using only a horizontal line. Without the source profile, it is impossible to tell whether the level was built in balance, during expansion, or in a late rotation. The final error is reading delta as a directional verdict. Delta measures aggressive execution at bid and ask. It does not reveal passive liquidity unless price response and footprint structure are examined alongside it.
Archive screenshots of completed sessions and first revisits. Label the profile type, VPOC location, nearby value structure, and the footprint behavior at interaction. After enough examples, the distinctions between accepted volume, absorbed aggression, and thin-auction movement become easier to see without overloading the chart.
A naked VPOC is most valuable when it stays connected to the auction that created it. Keep the level clean, preserve its profile context, and let the footprint show what actually trades when price reaches that unfinished reference.
See it on your own chart.
Every Sidi tool is unlocked in the free 14-day demo. Install SidiFootprint in NinjaTrader 8 and load one of the finished color styles to start.
Start free 14-day demo → SidiFootprint features Browse color stylesRelated articles
Stacked Imbalance Trading Strategy for Futures
Build a stacked imbalance trading strategy for futures with footprint context, delta, VPOC, absorption, and developing auction structure in real time.
Futures Footprint Interpretation Guide for Traders
This futures footprint interpretation guide explains delta, imbalances, VPOC, absorption, and developing profiles for auction context in NinjaTrader 8.

How Unfinished Auction Order Flow Reappears
Unfinished auction order flow shows where the previous auction stopped short. Read unfinished extremes with footprint, delta, VPOC, and session context.