
Stacked Imbalance Trading Strategy for Futures
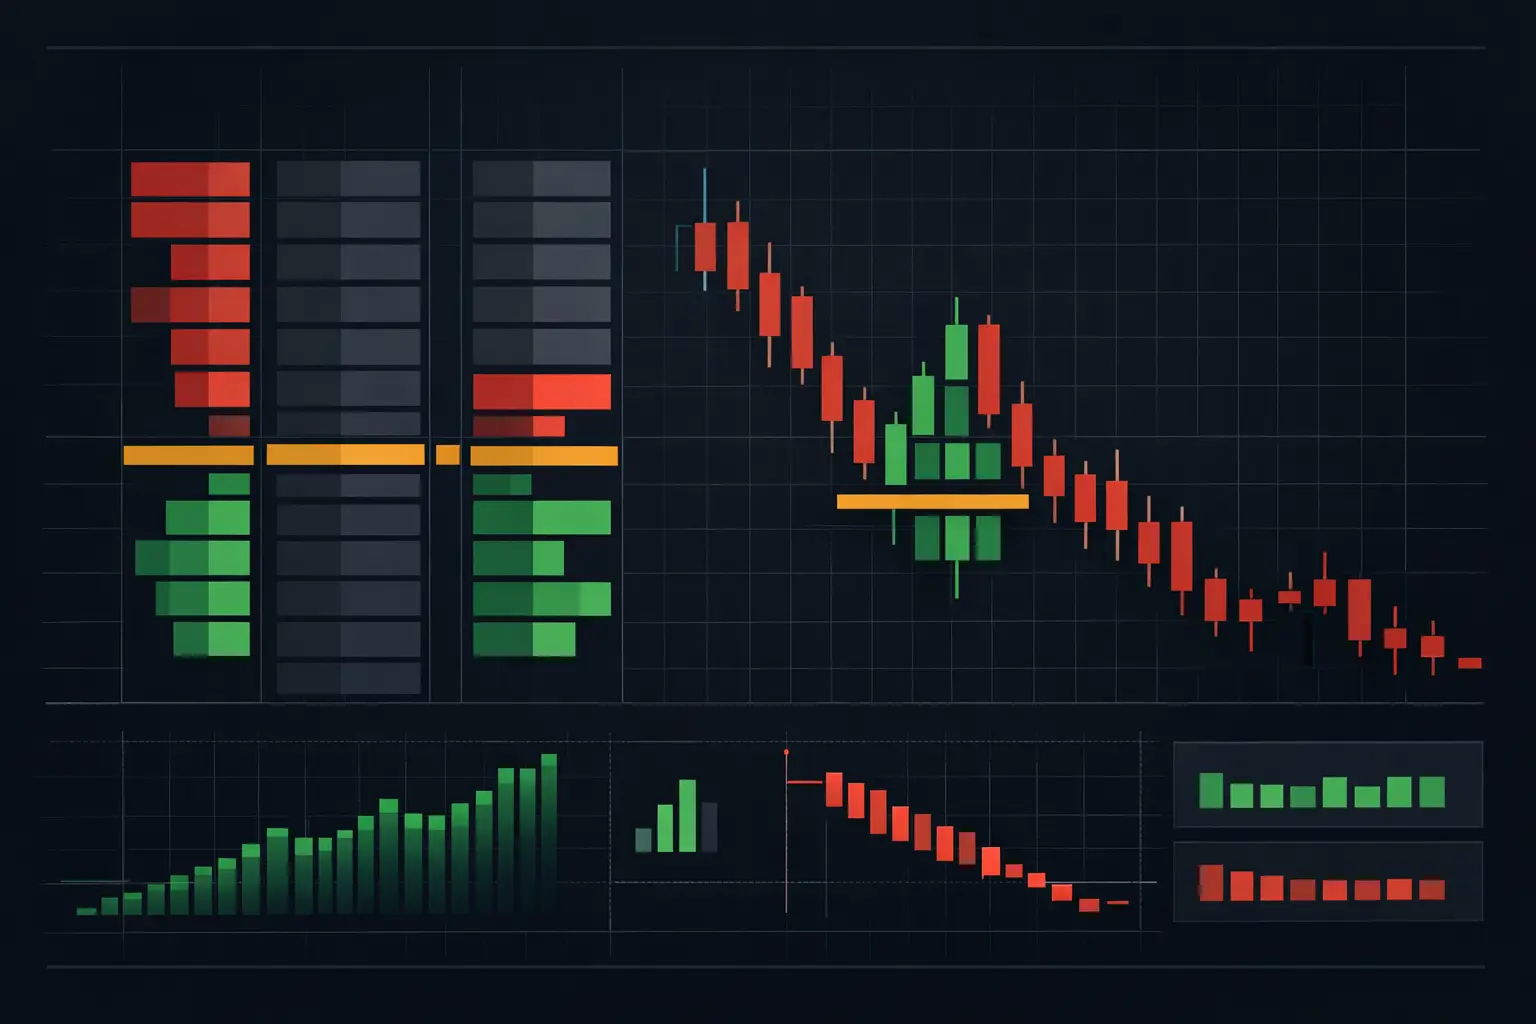
A stacked imbalance trading strategy for futures begins where candle charts stop: at the individual price level. A candle can show range and close location, but it cannot show whether aggressive buyers repeatedly lifted the offer through several adjacent prices or whether aggressive sellers drove the bid in a concentrated sequence. That distinction matters when ES, NQ, CL, or another liquid futures contract starts moving quickly.
Stacked imbalances are not standalone instructions. They are evidence of one-sided auction participation. Their value comes from location, continuation, response, and the surrounding order-flow structure. A stack printed in the middle of a balanced rotation carries different information from a stack that forms as price accepts above a developing session VPOC.
What a stacked imbalance shows
A diagonal footprint imbalance compares aggressive volume across adjacent price levels. On the buy side, ask volume at one price is compared with bid volume one tick below. On the sell side, bid volume at one price is compared with ask volume one tick above. When the configured ratio and minimum-volume threshold are met, the footprint marks that price as imbalanced.
A stacked imbalance is a sequence of these same-direction imbalances over consecutive price levels. Three adjacent buy imbalances, for example, show buyers repeatedly crossing the spread as price moves upward. The stack is more meaningful than one isolated highlighted cell because it exposes persistence. The auction did not merely print a large number at one level; aggression extended through the ladder.
The threshold matters. A low ratio can color large sections of an active footprint and reduce contrast. A high ratio can isolate only the clearest extremes but omit meaningful participation during quieter periods. There is no universal setting because contract liquidity, bar construction, and session conditions alter the distribution of bid and ask volume.
A usable configuration starts by defining an imbalance ratio, a minimum volume filter, and the minimum number of adjacent levels required to classify a stack. On a high-volume ES chart, the minimum-volume filter prevents trivial diagonal comparisons from receiving the same visual weight as substantial traded volume. On thinner contracts, an overly high threshold can erase the very auction detail the chart is intended to display.
Build the stacked imbalance trading strategy around context
The central mistake is treating every stack as equivalent. A footprint stack describes aggressive activity. It does not explain whether that aggression is initiating a new auction, extending an accepted auction, or being absorbed by resting liquidity.
Start with session structure. Locate the developing VPOC, the prior session VPOC, value-area boundaries, major high-volume nodes, and low-volume areas. These references establish whether the current auction is rotating through accepted volume or attempting to move away from it.
A buy stack that appears just above a value-area high has one meaning if price holds above the boundary and develops volume there. It has another if the stack drives into a prior high-volume node, stalls, and leaves repeated offer-side absorption. The first condition shows initiative lifting through a reference and subsequent acceptance. The second shows aggression meeting passive supply.
The same logic applies below value. A sell stack through a low-volume area can show fast directional participation because little prior business exists in that zone. But if price reaches a previously defended low and bid volume expands without further downward progress, the footprint is documenting a different event: sellers are active, yet the auction is not extending.
Read the stack with bar structure
The bar containing the stack supplies immediate context. Note where the stack begins, where it ends, how much of the bar it occupies, and whether the bar closes near its extreme. A buy stack at the lower portion of a wide upward bar is different from a buy stack printed only at the final two ticks of that bar.
Stack placement also matters across multiple developing bars. Consecutive buy stacks that migrate higher while pullbacks remain shallow show persistent initiative behavior. Stacks that repeatedly appear at the same upper price without meaningful upward extension may identify an area where aggressive activity is being met by passive liquidity.
This is why a footprint needs readable developing bars, not only completed-bar history. The sequence of aggression, response, and acceptance is the analysis. A static marker after the fact removes much of that sequence.
Confirm with delta, not delta alone
Bar delta and cumulative delta add a second view of the same auction. A stack of buy imbalances normally accompanies positive delta, but the relationship is not mechanically one-to-one. A bar can contain a visible buy stack and still finish with modest delta if sell aggression was active elsewhere in the range.
When buy stacks, positive bar delta, and rising cumulative delta align while price accepts above a structural reference, the footprint is showing broad agreement among aggressive participants. When buy stacks appear but cumulative delta weakens or price cannot hold the upper prices, the mismatch deserves attention. It may reflect absorption, late aggression, or two-way trade rather than clean continuation.
Do not reduce this to a color check. Delta is a measure of executed aggression, not a map of resting liquidity. Large positive delta at a high can occur because buyers are aggressively lifting offers into a participant willing to sell substantial size passively. The footprint's price-level detail reveals whether the auction continues through that interaction or stalls at it.
Separate continuation from absorption
Absorption is the required counterweight in any stacked imbalance framework. A sell stack shows that sellers crossed the bid. It does not prove that bids disappeared. If substantial bid-side execution prints at a low while price stops progressing downward, passive demand may be absorbing the selling.
Look for the relationship among traded volume, delta, range extension, and subsequent response. Heavy negative delta with little additional downside range is different from heavy negative delta that pushes through several levels and holds below them. The first condition may show absorption. The second shows that aggressive sellers were able to move the auction.
Exhaustion adds another layer. As an auction extends, footprint volume can thin near the extreme, particularly after a fast sequence of same-direction imbalances. Thin execution alone is not a conclusion, but thin volume followed by a failure to continue, opposite-side imbalance, and rotation back through the extreme is a materially different structure from sustained participation at the edge.
SidiFootprint can display imbalances, delta, VPOC, profiles, absorption, and exhaustion within the same NinjaTrader 8 workspace. The operational advantage is not placing more colors on a chart. It is keeping the auction references visible together, with independent profile columns and footprint settings configured for the contract and bar type being analyzed.
A practical chart workflow
Begin by organizing the chart so session profile references remain visible beside the footprint. Keep the developing VPOC and value areas identifiable without compressing the bid-by-ask cells. If a stack cannot be read against its location in the session, it has been stripped of its most useful context.
Then tune imbalance visualization for contrast. Use separate colors for buy and sell stacks, and reserve stronger color intensity for higher ratios or larger traded volume. A five-level stack with substantial volume deserves to stand apart from a three-level stack barely meeting the threshold. Visual hierarchy matters most when the tape accelerates.
Next, inspect the first response after the stack. Does price revisit the beginning of the stack and find participation again? Does it rotate directly back through the entire sequence? Does volume build above or below the stack, creating acceptance, or does the auction return to the prior VPOC? These observations convert a highlighted pattern into a structured read of the market.
Finally, preserve the chart's time logic. A stack during the opening auction, a stack during midday compression, and a stack near a scheduled volatility event occur in different participation environments. The footprint calculation is unchanged, but the meaning of volume and range expansion changes with the session's current structure.
Common configuration errors
Overmarking is the most common failure. If nearly every bar contains several stacks, the imbalance ratio or minimum-volume setting is likely too permissive for the instrument's current activity. The chart becomes visually busy while the genuinely unusual events lose emphasis.
The opposite error is filtering too aggressively. A setting calibrated only for peak-volume periods can leave a thin, empty footprint during slower conditions. A practical layout supports adjustment without rebuilding the workspace. Separate templates for different contracts or bar constructions keep the display aligned with the actual volume distribution.
Another error is using only one footprint metric. Bid-by-ask cells show executed aggression. Volume profiles show acceptance. Delta tracks directional pressure. VPOC identifies the price attracting the most trade. None replaces the others. The stacked imbalance becomes more precise when these tools remain independent but visible in the same decision frame.
A stacked imbalance is best treated as a footprint event with a location and a response. Read the sequence of prints, then watch whether the auction accepts those prices or rejects them. That discipline keeps attention on what actually traded at each level, especially when candles compress the most important information into a single colored bar.
See it on your own chart.
Every Sidi tool is unlocked in the free 14-day demo. Install SidiFootprint in NinjaTrader 8 and load one of the finished color styles to start.
Start free 14-day demo → SidiFootprint features Browse color stylesRelated articles
Futures Footprint Interpretation Guide for Traders
This futures footprint interpretation guide explains delta, imbalances, VPOC, absorption, and developing profiles for auction context in NinjaTrader 8.
Naked VPOC Trading Strategy for Futures
Map unfinished auction references with a naked VPOC trading strategy for futures, using footprint, delta, imbalances, and session context in real time.

NinjaTrader 8 Footprint Chart for Faster Reads
Build a NinjaTrader 8 footprint chart that exposes delta, imbalances, absorption, VPOC, and auction context when futures order flow accelerates fast.