
NinjaTrader 8 Footprint Chart for Faster Reads

Most traders see an ES candle break a prior high and are left guessing whether the move is driven by real initiative buying, short covering, or a thin liquidity pocket. A NinjaTrader 8 footprint chart replaces that guesswork with the executed bid and ask activity at every price inside the bar. It shows where the auction actually traded, who crossed the spread, and whether price acceptance supports the move.
That distinction matters most when the market moves quickly. A candle can look strong while aggressive buyers are repeatedly absorbed at the high. It can look weak while sellers fail to extend lower and buyers begin lifting offers underneath. Footprint data does not predict the next tick. It gives the trader a more precise read of participation, response, and location before conventional price action makes the story obvious.
What a NinjaTrader 8 Footprint Chart Should Show
A usable footprint is more than bid volume on the left and ask volume on the right. At minimum, it should let you inspect traded volume, bid volume, ask volume, delta, and trade count by price level. Those are the raw components of the auction. The edge comes from seeing their relationship to structure, liquidity, and time.
At a session high, for example, heavy ask volume can mean buyers are in control. But if that volume produces little upward progress, with a negative or fading delta response immediately afterward, the same print can point to passive sellers absorbing aggressive market buys. The number alone is not the evidence. The number, its location, and the resulting price response are the evidence.
A serious chart should also expose diagonal imbalances. A buy imbalance compares ask volume at one price with bid volume one tick below. A sell imbalance compares bid volume at one price with ask volume one tick above. This comparison matters because it measures aggression through the spread rather than simply displaying a large number at a single level.
Stacked imbalances are especially useful when they form through multiple adjacent prices. A stack of buy imbalances driving out of a balanced area can identify initiative participation. A stack appearing directly into a known higher-timeframe resistance level deserves more skepticism. Order flow is context-sensitive. Treating every imbalance as an entry trigger is how a useful tool becomes noise.
Start With the Data, Not the Colors
Footprint calculations depend on bid/ask classification. If the data feed, connection, or historical processing does not provide the required information, the chart cannot reconstruct institutional intent from missing inputs. Before tuning templates, confirm that your NinjaTrader 8 environment is receiving the market data required for bid/ask-based analysis and that your replay or historical workflow is consistent with the tool's calculation method.
Then decide what you need the bar to represent. A fast scalper may use smaller volume or range bars to isolate short-term shifts in aggression. An intraday trader may prefer time-based bars for alignment with scheduled events and session structure. Neither choice is universally superior. Small bars reveal detail but can produce excessive visual churn. Larger bars reduce noise but can hide the sequence of absorption and exhaustion that occurred inside the move.
The same trade-off applies to aggregation. A one-tick price row offers maximum resolution in ES, but it can make a high-volume session dense. Grouping multiple ticks into a row improves readability while reducing precision at the exact turning price. Build for the decisions you make, not for the most impressive-looking screenshot.
Configure the Footprint Around Execution Decisions
A footprint chart becomes effective when its visual hierarchy matches your process. Price must remain readable first. Then the information that changes your decision should be visible without hunting through menus or interpreting a dozen competing color rules.
For many futures traders, a practical starting layout uses bid x ask volume as the primary cell display, delta as a secondary statistic, and imbalance highlighting only above a meaningful threshold. Set the threshold too low and nearly every active bar becomes colored. Set it too high and the chart ignores the participation that matters at rotational extremes. The right ratio depends on instrument behavior, bar type, and the time of day.
Keep session references on the same workspace. Developing VPOC, value area high, value area low, prior session levels, opening range, and overnight extremes give footprint events a location. A sell imbalance in the middle of a quiet balance is different from a sell imbalance that rejects value area high after a failed auction. Without profile context, the trader sees aggression but not whether that aggression is occurring at a meaningful auction reference.
Configure alerts for conditions that are difficult to monitor manually during execution. Examples include stacked imbalances, large delta thresholds, absorption events, exhaustion prints, and tests of a developing VPOC. Alerts should narrow attention, not automate conviction. A text-to-speech alert can keep a trader aware of an event while managing an open position, but the chart still determines whether the event has usable location and follow-through.
SidiFootprint is built for this level of control, with more than 1,000 configuration options, independent profile columns, and integrated order-flow analytics in a NinjaTrader 8 workflow. The point is not to turn every option on. It is to build a chart that presents your highest-value information at execution speed.
Read Delta as Evidence, Not Direction
Delta is ask volume minus bid volume. Positive delta shows more volume transacted at the ask; negative delta shows more volume transacted at the bid. That is a record of aggressive execution, not proof of directional continuation.
Positive delta that lifts price through a prior high and holds above it supports the case for initiative buying. Positive delta that repeatedly hits a high with no extension can reveal absorption. In that case, passive liquidity is accepting the market buys. If price rotates lower after the effort, trapped late buyers may add fuel to the reversal.
The inverse applies at lows. Negative delta can confirm sellers pressing through a reference. But heavy negative delta at a low that refuses to break, followed by a sharp recovery, often points to seller exhaustion or passive buying. The market is showing that aggressive selling is no longer producing the expected result.
Cumulative delta adds another layer by tracking the running difference between ask and bid volume. Use it to compare participation with price development, not as a standalone oscillator. If price makes new highs while cumulative delta fails to confirm, that divergence can be useful. It can also persist for far longer than a trader expects in a strong trend. The actionable question is whether the divergence appears at a defined auction location and whether the footprint shows failed continuation.
Absorption and Exhaustion Need a Response Test
Absorption is not merely high volume. It is substantial aggressive activity meeting passive liquidity with limited price progress. A footprint can highlight unusually large prints or delta extremes, but the confirmation comes from what price does after those prints. Does the level hold? Does the next bar reverse? Does the market regain a nearby VPOC or fail back inside value?
Exhaustion is different. It often appears as a thinning of traded volume at the terminal edge after a directional auction. Traders sometimes confuse low volume with exhaustion automatically. Low volume in the middle of a session can simply be inactivity. At the end of an extended auction into a known level, followed by an inability to continue, it has far more meaning.
This is why developing bars matter. Waiting for a completed bar provides confirmation, but it can delay the best risk location. Watching the developing footprint allows earlier recognition of absorption or fading aggression. The trade-off is false information before the bar closes. Use developing data to prepare, then require price response and location before committing size.
Keep Profiles Independent From the Footprint
Volume profiles answer a different question than the footprint. The footprint shows how trading occurred at each price inside a bar. The profile shows where the market accepted volume across a chosen period. Combining both on one chart is powerful when the columns remain visually independent.
A developing session profile identifies the evolving VPOC and value area. A separate fixed-range or composite profile can show higher-timeframe acceptance. When price returns to a composite VPOC, the footprint tells you whether the level is being accepted again or rejected by aggressive participation. That is far more useful than treating every profile line as automatic support or resistance.
Watch for the market's behavior around low-volume areas as well. A fast traverse through a low-volume node can indicate the auction is seeking the next acceptance zone. If the footprint begins showing opposing stacked imbalances and absorption inside that traverse, the expected continuation may be failing. The chart should help you recognize that change before it becomes a full candle reversal.
Build One Repeatable Review Process
Do not judge a footprint setup by one winning trade. Review it after the session using the same questions: Where was the market relative to value? Which side initiated the move? Did delta produce price progress? Where did absorption occur? Did the market accept or reject the breakout?
Save screenshots of clean examples and failed examples. The failed examples are often more valuable because they expose where your rules confuse aggression with continuation or ignore larger auction context. Over time, reduce the visual elements that do not affect decisions and preserve the ones that repeatedly improve your read.
When the tape accelerates, the advantage is not having more indicators on screen. It is seeing the critical interaction between aggressive orders, passive liquidity, and auction location quickly enough to act with defined risk.
See it on your own chart.
Every Sidi tool is unlocked in the free 14-day demo. Install SidiFootprint in NinjaTrader 8 and load one of the finished color styles to start.
Start free 14-day demo → SidiFootprint features Browse color stylesRelated articles
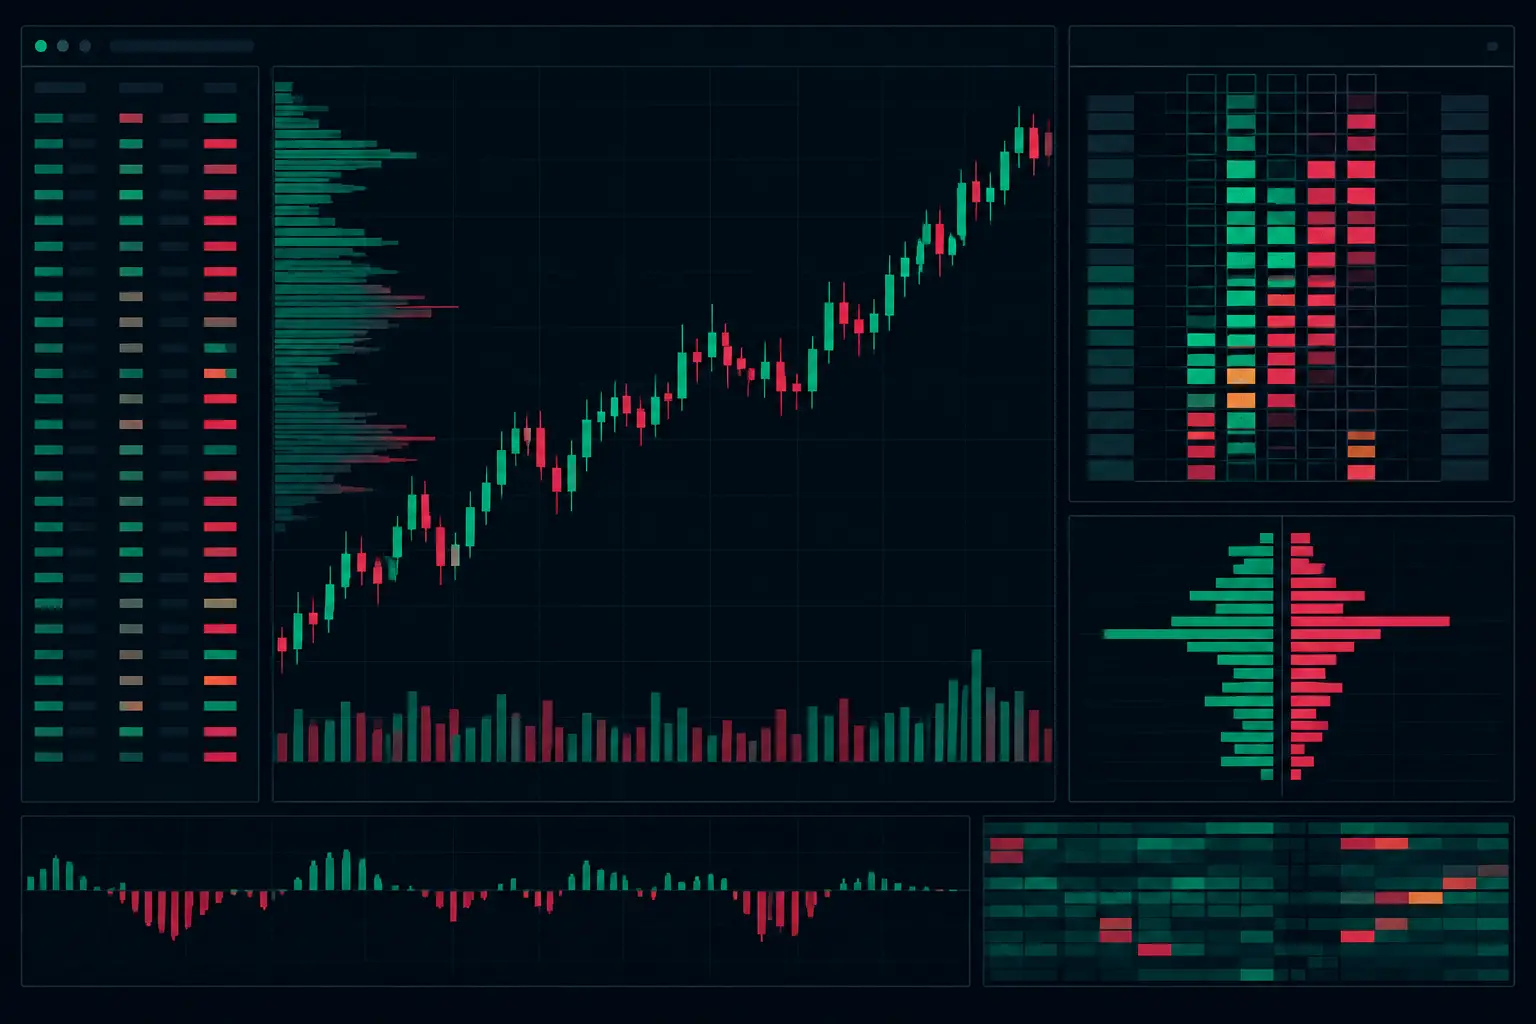
Futures Footprint Interpretation Guide for Traders
This futures footprint interpretation guide explains delta, imbalances, VPOC, absorption, and developing profiles for auction context in NinjaTrader 8.
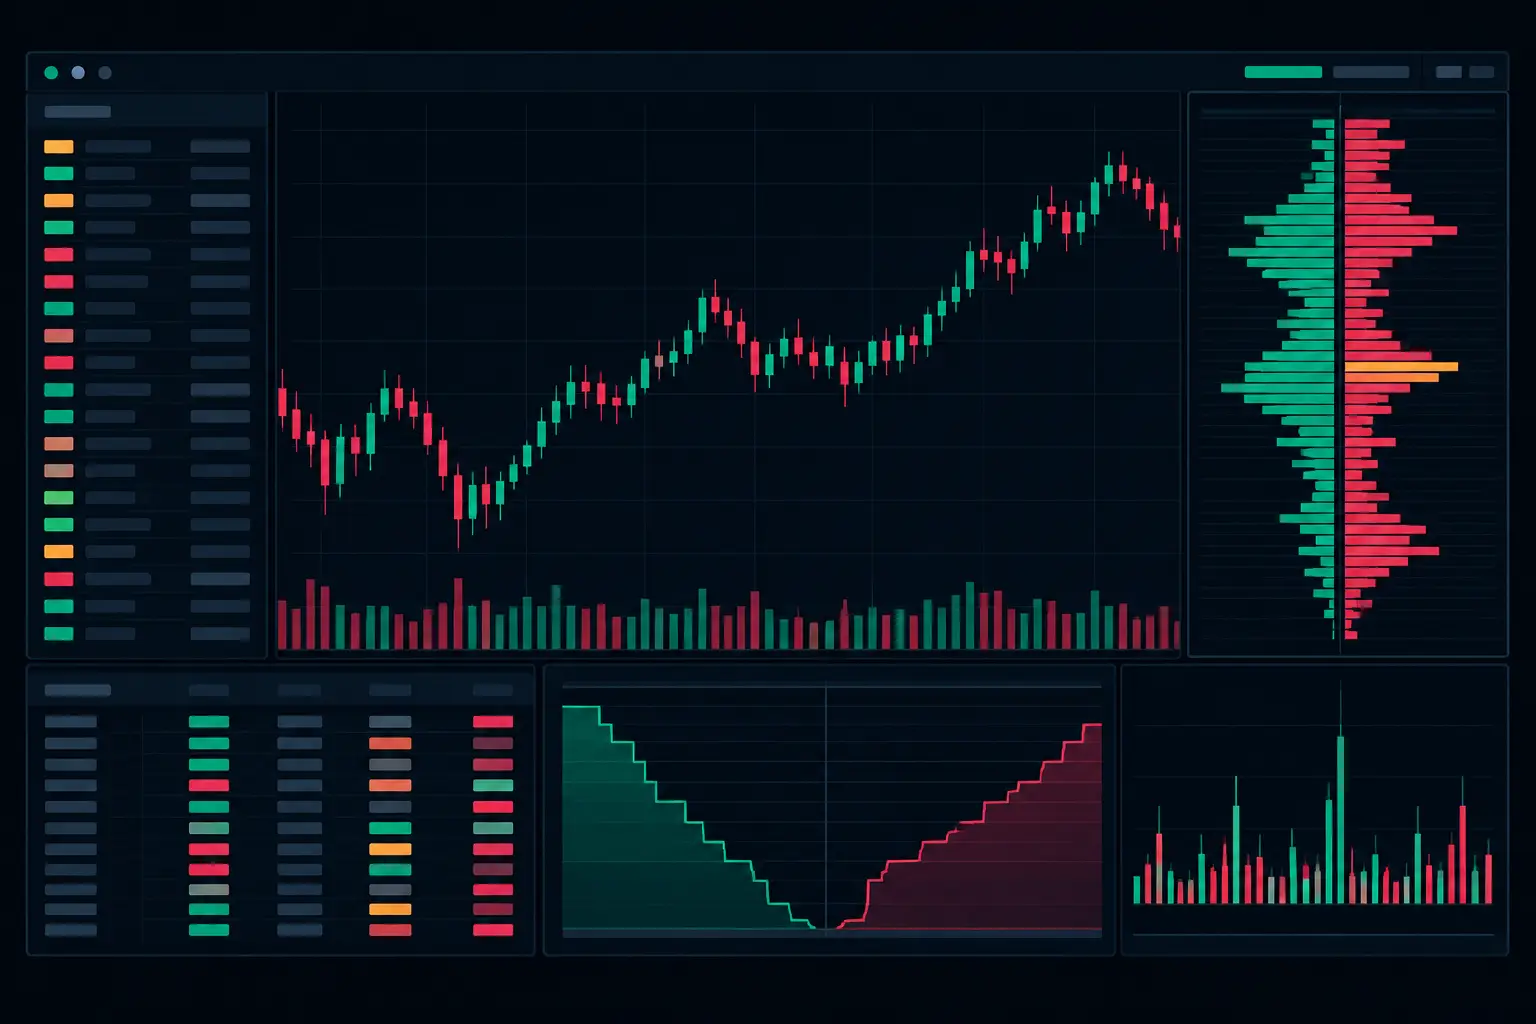
Futures Order Flow Visualization Guide for E-mini
Use this futures order flow visualization guide to configure footprint, delta, VPOC, profiles, and imbalance context for fast E-mini auctions each day.
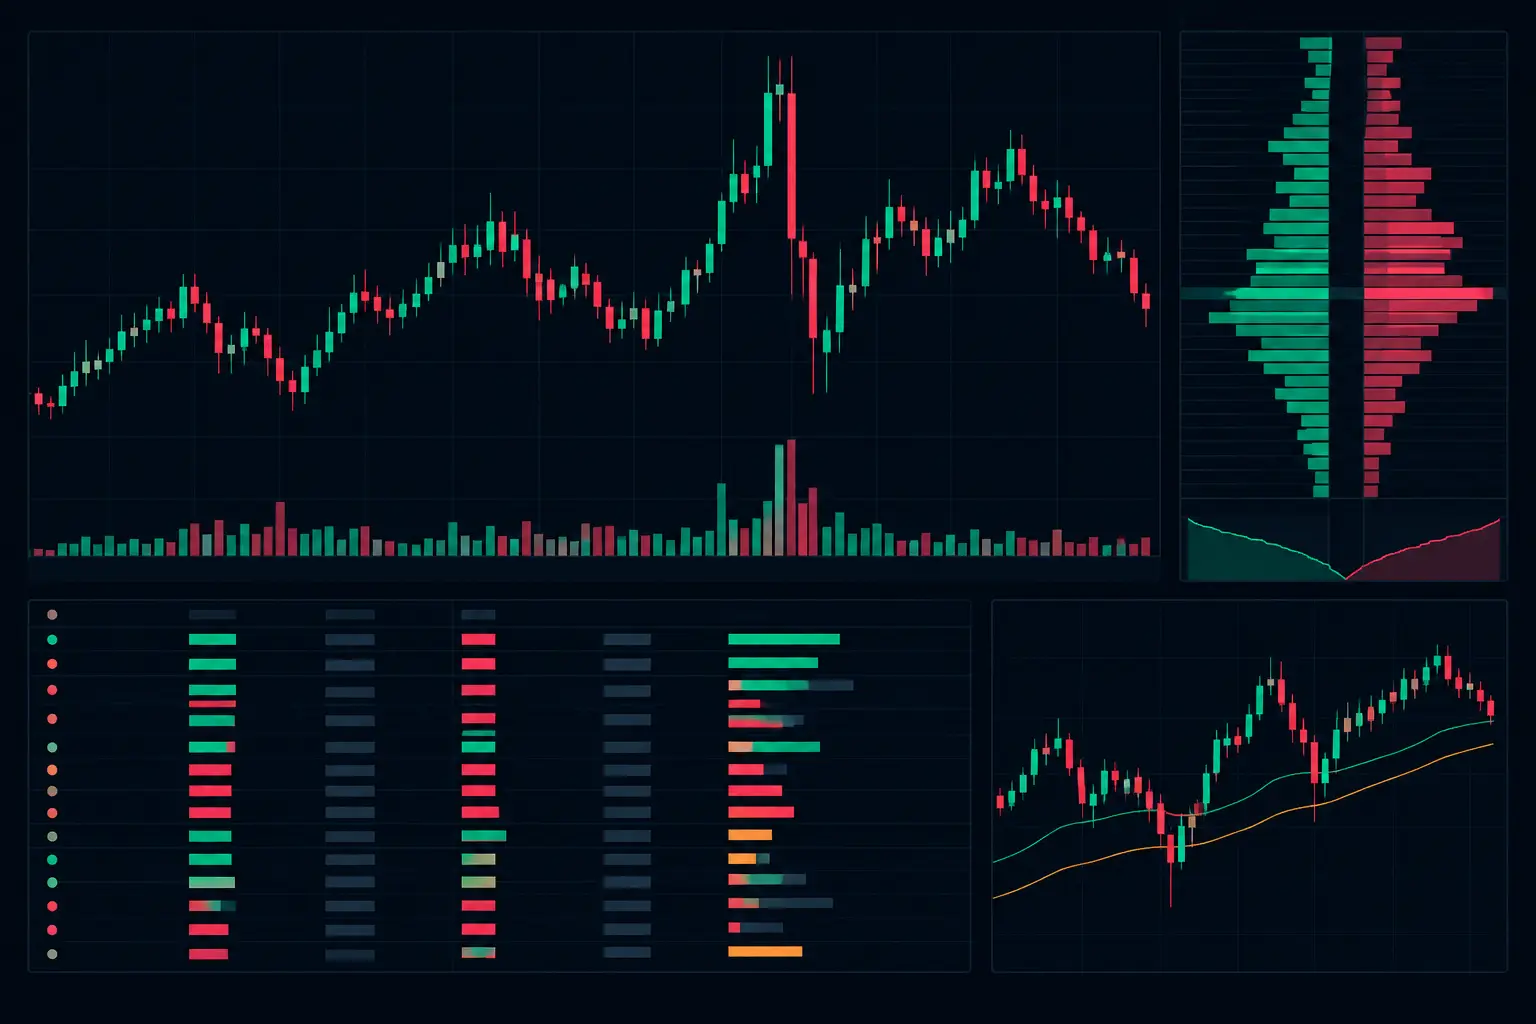
High Volatility Order Flow Example Explained
A high volatility order flow example shows how delta, stacked imbalances, absorption, and VPOC expose the auction when price accelerates across the range.