
High Volatility Order Flow Example Explained
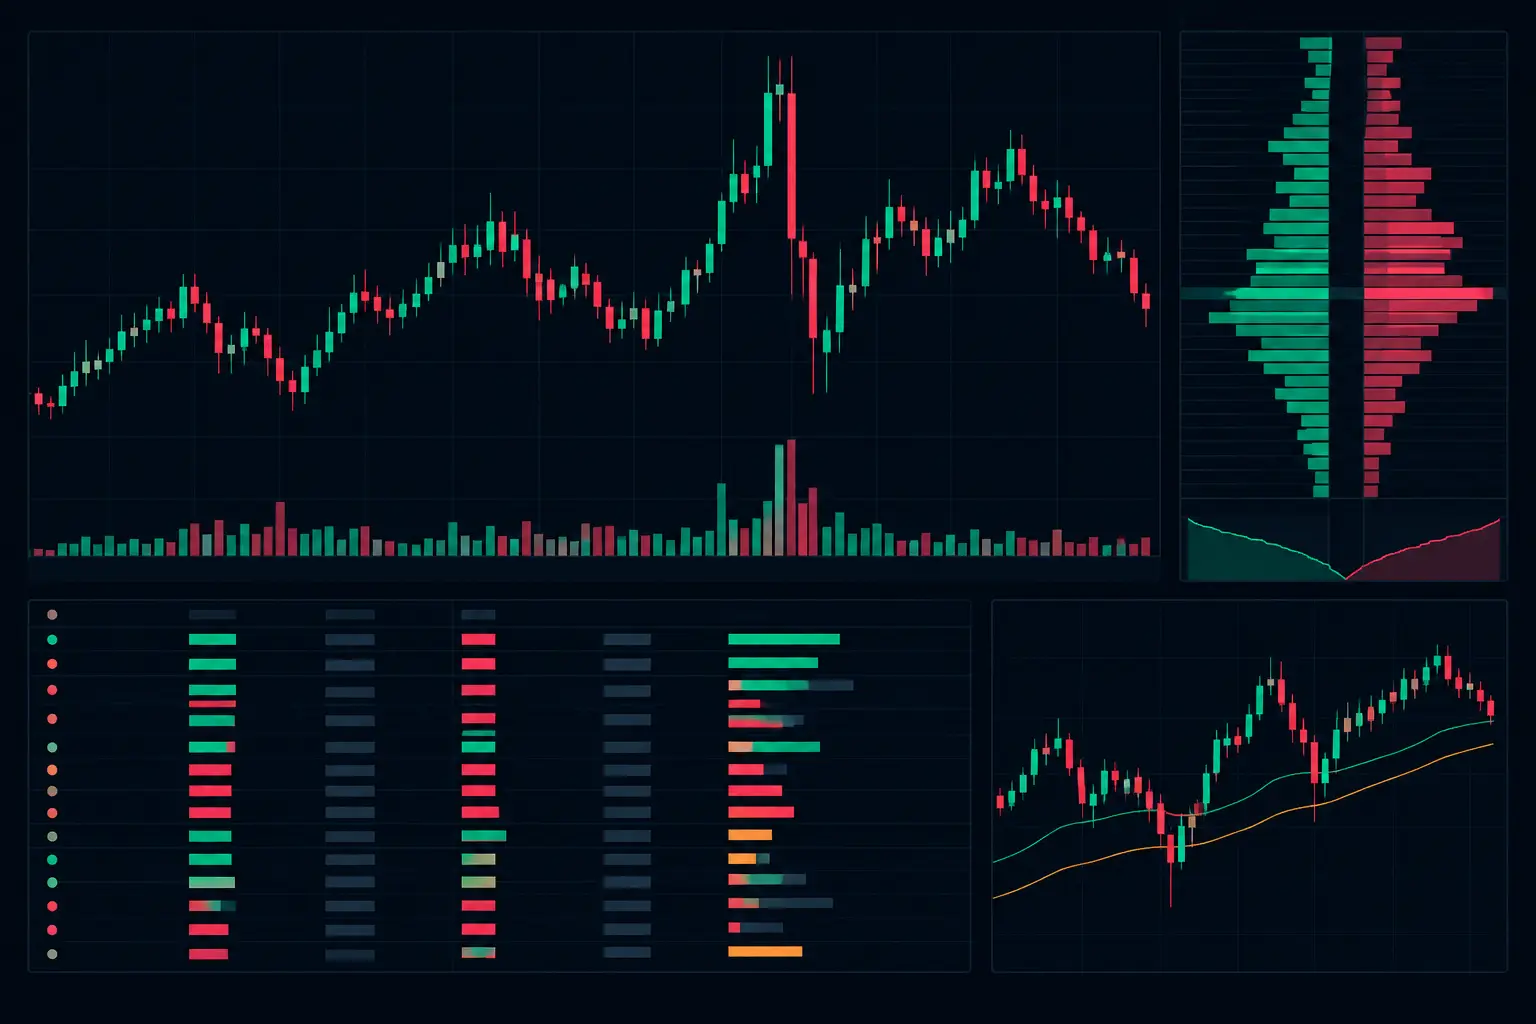
A high volatility order flow example is not simply a large candle with elevated volume. The defining feature is a rapid repricing auction in which aggressive orders repeatedly consume available liquidity, passive participants either reload or withdraw, and the footprint exposes exactly where that interaction occurred. Candles show the distance traveled. Order flow shows whether that distance was accepted, rejected, or driven through thin participation.
Consider an E-mini S&P 500 futures session opening near a prior session value-area boundary. Price rotates briefly, then expands upward through several price levels in seconds. A conventional chart presents a green bar. A footprint chart can show whether the bar contained persistent ask-side initiative, a sequence of diagonal imbalances, a developing VPOC that migrated higher, or late buying absorbed at the high. Those are materially different auction conditions even when the candle closes in the same location.
What High Volatility Changes in the Footprint
Volatility changes the pace of the auction, but it also changes the meaning of individual prints. During a balanced rotation, isolated bid or ask volume can be ordinary two-way trade. During expansion, the same print may sit inside a rapid sequence of liquidity consumption and carry more structural weight when it aligns with delta, imbalance, and profile migration.
The chart must remain readable while developing bars update rapidly. That means separating three questions: where did aggressive volume trade, where did price spend time, and where did passive liquidity resist or yield? Bid x ask footprint cells answer the first question. Volume profile and VPOC answer the second. Absorption and exhaustion behavior provide context for the third.
A high-volume bar is not automatically directional. If large volume trades at the offer but price cannot extend beyond the level, passive sellers may be absorbing aggressive buyers. If price advances with relatively low volume through a thin section of the profile, the auction may be moving because resting liquidity was pulled rather than because an exceptional quantity traded. The footprint distinguishes these cases.
High Volatility Order Flow Example: Opening Range Expansion
Assume ES opens inside the prior session's value area, with the prior VPOC several points below the opening price. The first few minutes establish a narrow range. At the upper edge, ask volume begins lifting repeatedly:
- 5,240.25 prints 180 x 640
- 5,240.50 prints 155 x 710
- 5,240.75 prints 130 x 860
- 5,241.00 prints 95 x 1,020
The left number is volume executed at the bid. The right number is volume executed at the ask. In a diagonal imbalance calculation, each ask volume is compared with bid volume one tick below. At 5,240.50, for example, 710 ask volume is compared with 180 bid volume at 5,240.25. With an imbalance ratio configured at 300%, that relationship qualifies as an ask-side imbalance.
Four consecutive qualifying levels form a stacked ask imbalance. During a fast auction, that stack matters more than a single highlighted cell because it shows initiative activity distributed through the vertical auction rather than concentrated at one price. Price is not merely touching the range high. Aggressive buyers are lifting offers across multiple levels while the available liquidity above is being consumed.
At the same time, bar delta expands from +1,100 to +3,800, and the developing bar VPOC shifts from 5,240.25 to 5,241.00. The VPOC migration indicates that the heaviest traded volume is relocating upward as the bar develops. This is different from a bar that spikes above the range, prints heavy volume at the high, and leaves its VPOC near the original breakout level.
The next bar trades through 5,242.00 with less total volume than the initial expansion bar. That does not weaken the reading by itself. The profile may show a low-volume area above the opening range, allowing price to traverse a section where little two-way trade is required. High volatility often appears as alternating phases: heavy initiative volume at the edge, fast travel through a thin area, then renewed volume as the auction reaches a location where participants engage again.
The Critical Test: Acceptance or Absorption
The useful part of the example arrives at 5,243.50. Aggressive buying remains visible, with 1,400 to 1,900 contracts repeatedly trading at the ask. Yet the price level stops advancing. Several footprint rows display positive delta, but the high does not extend. The bar's upper prices accumulate volume while the developing VPOC remains one or two ticks below the extreme.
That is an absorption condition: aggressive buyers are executing, while passive sell liquidity is meeting that activity without allowing further auction progress. The footprint does not identify the participant behind the resting orders, and it does not need to. What matters is the observable relationship between executed ask volume and the lack of upward price movement.
A practical chart layout makes this visible without forcing the trader to infer it from a single color. Show bid x ask values inside the footprint, apply diagonal imbalance coloring, display bar delta, and place a developing VPOC marker on each bar. A second profile column can display the session distribution beside the footprint while an independent bar profile reveals the internal volume concentration of each developing bar.
If the session profile has a prominent high-volume node near 5,243.50, the absorption is occurring at an established area of trade. If the level sits at the edge of a low-volume area, the market may be testing whether that thin section can become accepted. Context changes the interpretation. Identical delta at different profile locations does not describe the same auction.
Why Cumulative Delta Needs Location
Cumulative delta often rises sharply during high-volatility expansion. That confirms net aggressive buying across the selected calculation period, but it does not confirm that price is accepting higher levels. Cumulative delta is an activity measure, not a standalone map of auction location.
In this example, cumulative delta may continue making new session highs while price stalls at 5,243.50. That divergence is not a mechanical conclusion. It is a prompt to inspect the footprint for absorption, unfinished auction behavior, and the location of the developing VPOC. If price later rotates lower while cumulative delta remains elevated, the chart documents that aggressive buying occurred at higher prices but did not secure continued upward progress.
The reverse structure appears in fast downside movement. Consecutive bid-side diagonal imbalances, negative delta, and a VPOC migrating lower show initiative selling. But if heavy bid volume repeatedly trades at a low without further extension, passive buyers may be absorbing the selling. High volatility does not eliminate auction logic. It compresses the time available to observe it.
Configure the Chart for Speed, Not Decoration
A footprint during rapid movement needs visual hierarchy. Excessive colors, oversized text, and every possible marker enabled at once can obscure the exact relationships that matter. The goal is to preserve price-level detail without delaying recognition of stacked imbalances, VPOC migration, and absorption.
For a fast intraday layout, use a readable bid x ask display, distinct colors for qualifying buy and sell imbalances, and a clear developing VPOC line. Keep delta visible at the bar level rather than relying only on a separate lower panel. Session value area and session VPOC provide higher-timeframe auction context, while bar profiles expose where the current expansion is actually building volume.
Imbalance thresholds require instrument-specific tuning. A 300% ratio can reveal meaningful initiative in ES under many conditions, but the minimum volume filter determines whether small prints receive attention. During quiet periods, a lower threshold may reveal participation that would otherwise remain hidden. During a high-volume release or opening expansion, that same threshold may color too much of the footprint. The setting should preserve contrast, not turn every active row into an imbalance.
SidiFootprint supports independent profile columns, configurable footprint calculations, developing VPOC displays, and absorption or exhaustion visualization inside the NinjaTrader 8 workspace. The advantage is not adding more objects to the chart. It is organizing the chart so the structure of a fast auction remains visible while each bar develops.
Read the Sequence, Not the Highlight
The strongest reading from a high-volatility footprint comes from sequence. First, aggressive activity enters at a known range edge. Then stacked imbalances show whether initiative participation persists through multiple prices. Next, VPOC and profile behavior reveal whether volume is relocating with price or accumulating against it. Finally, absorption or exhaustion shows whether the auction can continue through the new area.
One bright imbalance cell can be noise. One large delta bar can be late activity. A coherent sequence across footprint cells, developing bars, and session structure is harder to dismiss because it describes how the auction changed state.
When the tape accelerates, do not reduce the chart to a faster version of a candle chart. Keep the price-level evidence intact. The most useful high-volatility order flow example is the one where the footprint makes clear not only that price moved, but what traded at each level while the market decided whether that movement could hold.
See it on your own chart.
Every Sidi tool is unlocked in the free 14-day demo. Install SidiFootprint in NinjaTrader 8 and load one of the finished color styles to start.
Start free 14-day demo → SidiFootprint features Browse color stylesRelated articles

NinjaTrader 8 Footprint Chart for Faster Reads
Build a NinjaTrader 8 footprint chart that exposes delta, imbalances, absorption, VPOC, and auction context when futures order flow accelerates fast.
Footprint Chart Software for Faster Order Flow
Footprint chart software for NinjaTrader 8 shows bid/ask activity, delta, imbalances, profiles, and absorption at every traded price level in real time.

Customize Text to Speech Alerts for Order Flow
Learn to customize text to speech alerts for footprint charts, so stacked imbalances, VPOC shifts, absorption, and developing bars remain clearly audible.