
Footprint Chart Software for Faster Order Flow
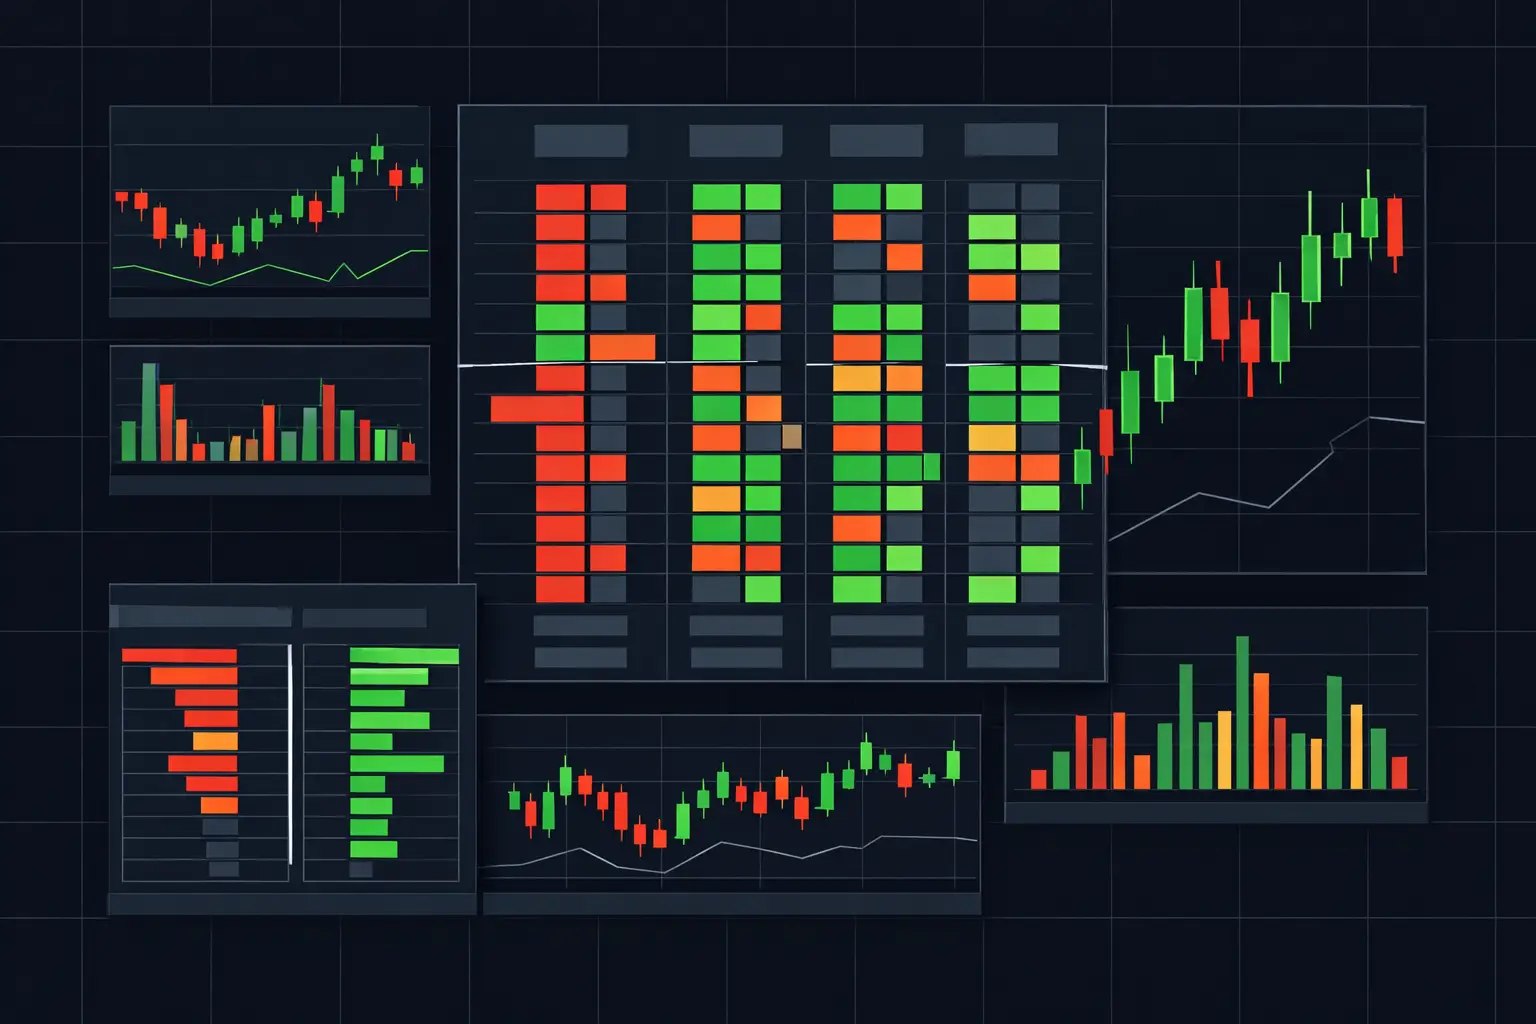
Most traders stare at candles and infer participation after the fact. Footprint chart software replaces that approximation with the auction data inside each bar: volume executed at bid and ask, delta, trade count, imbalance structure, and profile location at every price level.
For active futures traders, the difference is operational. A candle can show that price traveled six ticks. A footprint can show whether that movement was driven by persistent market buying, whether passive liquidity absorbed it at the high, and whether the bar closed with unfinished business. That is the information layer conventional bars leave out.
What Footprint Chart Software Actually Shows
A footprint chart organizes executed transactions by price rather than reducing an entire bar to open, high, low, and close. Each row represents a price level. The cells on that row display bid volume, ask volume, delta, total volume, trades, or another selected calculation. The result is a direct view of what actually traded during the auction.
Bid volume records contracts transacted at the bid. Ask volume records contracts transacted at the ask. Their difference is delta. Positive delta indicates more volume executed at the ask than the bid at that level; negative delta indicates the reverse. Delta is not a directional verdict. It is a measure of aggressive participation, and its value depends on where it appears, how it develops, and what price does next.
That context is where footprint analysis earns its place. Heavy positive delta pushing through a prior high has a different character from heavy positive delta that repeatedly fails to advance price. In the second case, the chart may be exposing absorption: aggressive buyers are active, but resting liquidity is accepting the flow. The same logic applies at lows, session extremes, prior value boundaries, and high-volume nodes.
The bar is only the container
A useful footprint does not stop at bid and ask numbers. It lets traders define the visual hierarchy that matters to their process. Total volume can reveal the most active prices. Delta can isolate aggressive pressure. Trade count can distinguish broad participation from a smaller number of larger transactions. Percentage delta can normalize activity when raw volume varies sharply across sessions.
The bar itself becomes a container for these calculations. Developing bars show how the auction is forming before close, while historical bars preserve the completed structure. A platform that handles both cleanly lets a trader study the same information in replay, during preparation, and while the tape is moving quickly.
Why Speed and Rendering Control Matter
Footprint analysis is data-dense by design. Every additional calculation, profile column, highlighted imbalance, value-area marker, and custom color rule adds visual workload. If the chart updates slowly or compresses critical information into an inflexible template, the tool becomes a bottleneck precisely when order flow accelerates.
Rendering performance matters because the chart is not a report viewed after the session. It is a live workspace. Fast updates preserve the relationship between current bid/ask activity, developing delta, and the price levels immediately above and below the market. Slow processing breaks that relationship and forces the trader to work from stale visual context.
Control matters for the same reason. One trader may need large bid-by-ask cells, diagonal imbalance highlights, and a session profile for an E-mini S&P 500 futures chart. Another may prioritize compact delta cells, dual profile columns, and absorption markers across a multi-chart layout. Neither workflow is universally correct. The software should support both without forcing the chart into a fixed visual language.
SidiFootprint is engineered for this kind of execution-grade use inside NinjaTrader 8, with more than 1,000 configuration options and stated rendering performance up to 7 times faster than competing footprint tools. The point is not configuration for its own sake. It is the ability to keep high-value order-flow information visible without turning the chart into visual noise.
Configure the Footprint Around the Auction
The most effective footprint layouts answer a narrow set of questions quickly: Where did aggressive volume transact? Where was it accepted or absorbed? Which prices carried the session's most meaningful volume? What is developing now versus what is already complete?
Start with the cell content. Bid-by-ask is the direct format for reading aggression on each side of the market. Bid-by-ask with delta adds immediate balance information. Total volume with delta is often cleaner when cell width is limited. The correct choice depends on whether the chart is being used for granular tape reading or broader auction structure.
Next, define the bar aggregation. Smaller aggregations preserve detail but create more bars and more visual density. Larger aggregations make profile structure easier to read but can combine distinct auction events. There is no default setting that fits every instrument or timeframe. The useful setting is the one that retains meaningful price-level structure at the pace being analyzed.
Color rules should reinforce calculations, not decorate them. A delta color gradient can make pressure changes readable at a glance. Separate colors for bid and ask cells preserve side-specific context. Minimum-volume thresholds prevent isolated small prints from receiving the same visual weight as meaningful activity. Contrast should remain sufficient when bars develop quickly, especially on dense multi-monitor workspaces.
Read imbalances as relationships, not isolated highlights
Imbalances compare aggression across adjacent price levels. A diagonal ask imbalance compares ask volume at one price with bid volume one tick below. A diagonal bid imbalance compares bid volume at one price with ask volume one tick above. This preserves the directional structure of the auction: buyers lifting offers upward or sellers hitting bids downward.
Ratio and minimum-volume thresholds determine what qualifies as an imbalance. A lower threshold displays more events and can be useful in quieter conditions. A higher threshold filters the chart toward more concentrated participation. Stacked imbalances add another layer by identifying consecutive qualifying levels. A stack near an important auction reference carries different structural information than a single highlighted cell in the middle of a balanced bar.
The location remains essential. An ask imbalance at a session high that immediately meets opposing volume is not equivalent to an ask imbalance that persists through multiple price levels. Footprint chart software should let those structures remain visible without obscuring the underlying numbers that produced them.
Profiles Turn Prints Into Location
A footprint shows transaction detail. A volume profile organizes that detail into auction location. Used together, they prevent a chart from becoming a collection of disconnected numbers.
VPOC identifies the price with the highest volume in a chosen profile. Value area defines the range containing a selected percentage of volume around that central activity. Session profiles show where the market spent time and volume during a defined session. Bar profiles narrow that view to the individual bar. These are not interchangeable references: a session VPOC can remain relevant well after a bar-level VPOC has lost immediate relevance.
Dual independent profile columns are particularly useful when two contexts need to coexist. A trader can place a session volume profile beside a delta profile, or compare current-session activity with a separate composite view. Independent calculation settings, alignment, width, color, value-area display, and VPOC treatment allow the profile columns to support the chart rather than dominate it.
Developing VPOC is also worth separating from completed VPOC. As volume accumulates, the developing point of control can migrate between prices. That migration shows where activity is concentrating in real time. Once the defined profile completes, its final VPOC becomes a fixed reference. Treating both as the same object removes useful auction detail.
Absorption and Exhaustion Need Rules
Absorption and exhaustion are frequently described too loosely. On a footprint, they should be defined with observable conditions and configurable thresholds.
Absorption occurs when aggressive volume meets passive liquidity and price fails to continue as expected from that aggression alone. At a high, repeated ask volume and positive delta may print while price holds within a narrow range or cannot extend. At a low, repeated bid volume and negative delta may appear while price stops moving lower. The footprint does not reveal every resting order, but it shows the executed pressure and the price response to it.
Exhaustion is different. It often appears as diminishing participation at an extreme, a thin final push, or a sharp reduction in volume after sustained auction movement. Its reading depends on prior activity and surrounding structure. A low-volume extreme in isolation is merely a low-volume extreme. The chart becomes more informative when that print is read beside delta, profile location, prior extremes, and subsequent acceptance or rejection.
Configurable detection tools can highlight these conditions, but thresholds should be matched to the instrument's normal activity. A setting that is useful during a high-volume US session can be too sensitive during quieter periods. Alerts and text-to-speech notifications can call attention to defined order-flow events without requiring constant visual scanning, while the chart remains the source of context.
Build a Chart That Preserves Decision Context
The best footprint layout is not the one with the most studies enabled. It is the one that keeps the relevant relationship visible: aggression versus response, volume versus location, and developing activity versus completed structure.
Start with one footprint calculation, one imbalance rule, and one profile context. Add absorption or exhaustion highlighting only after the core chart remains readable. Then test the layout across fast and slow conditions. If a key cell cannot be read, a profile obscures bar structure, or color rules compete for attention, reduce the display before adding more features.
A properly configured footprint chart does not simplify the auction. It exposes its detail in a form that can still be read when the tape speeds up. Keep the calculations visible, keep the references distinct, and let every element on the chart earn its space.
See it on your own chart.
Every Sidi tool is unlocked in the free 14-day demo. Install SidiFootprint in NinjaTrader 8 and load one of the finished color styles to start.
Start free 14-day demo → SidiFootprint features Browse color stylesRelated articles
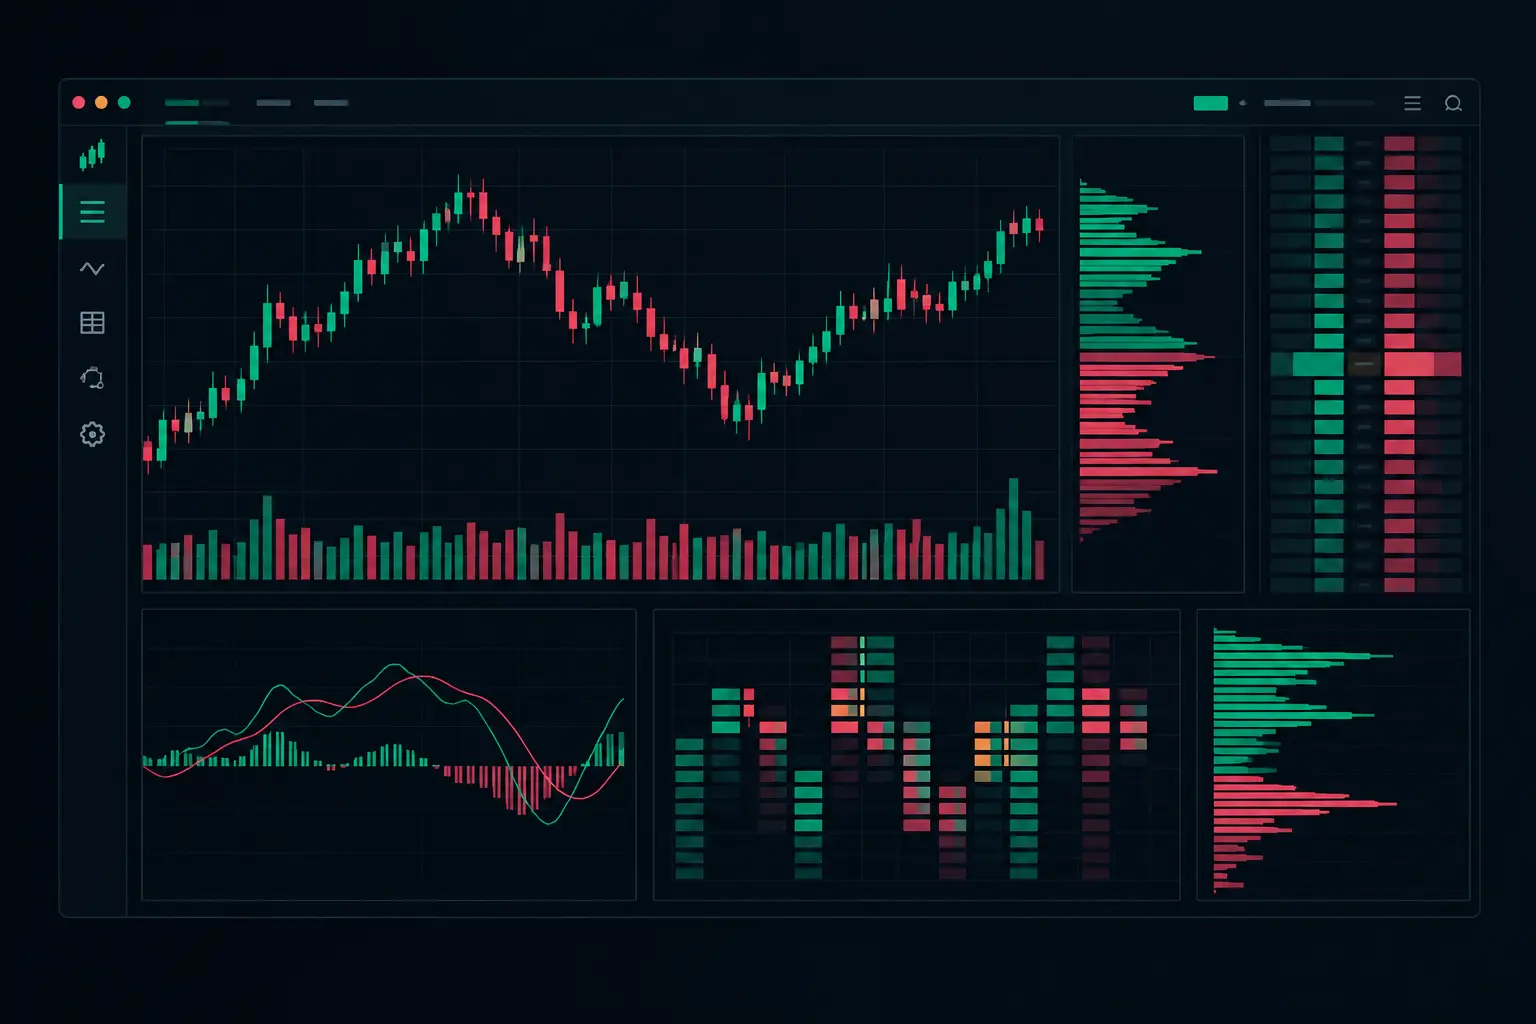
NinjaTrader Indicators for Order Flow Control
NinjaTrader indicators turn bid/ask activity into real-time chart context. Configure footprint, profile, delta, and alerts for active futures markets.
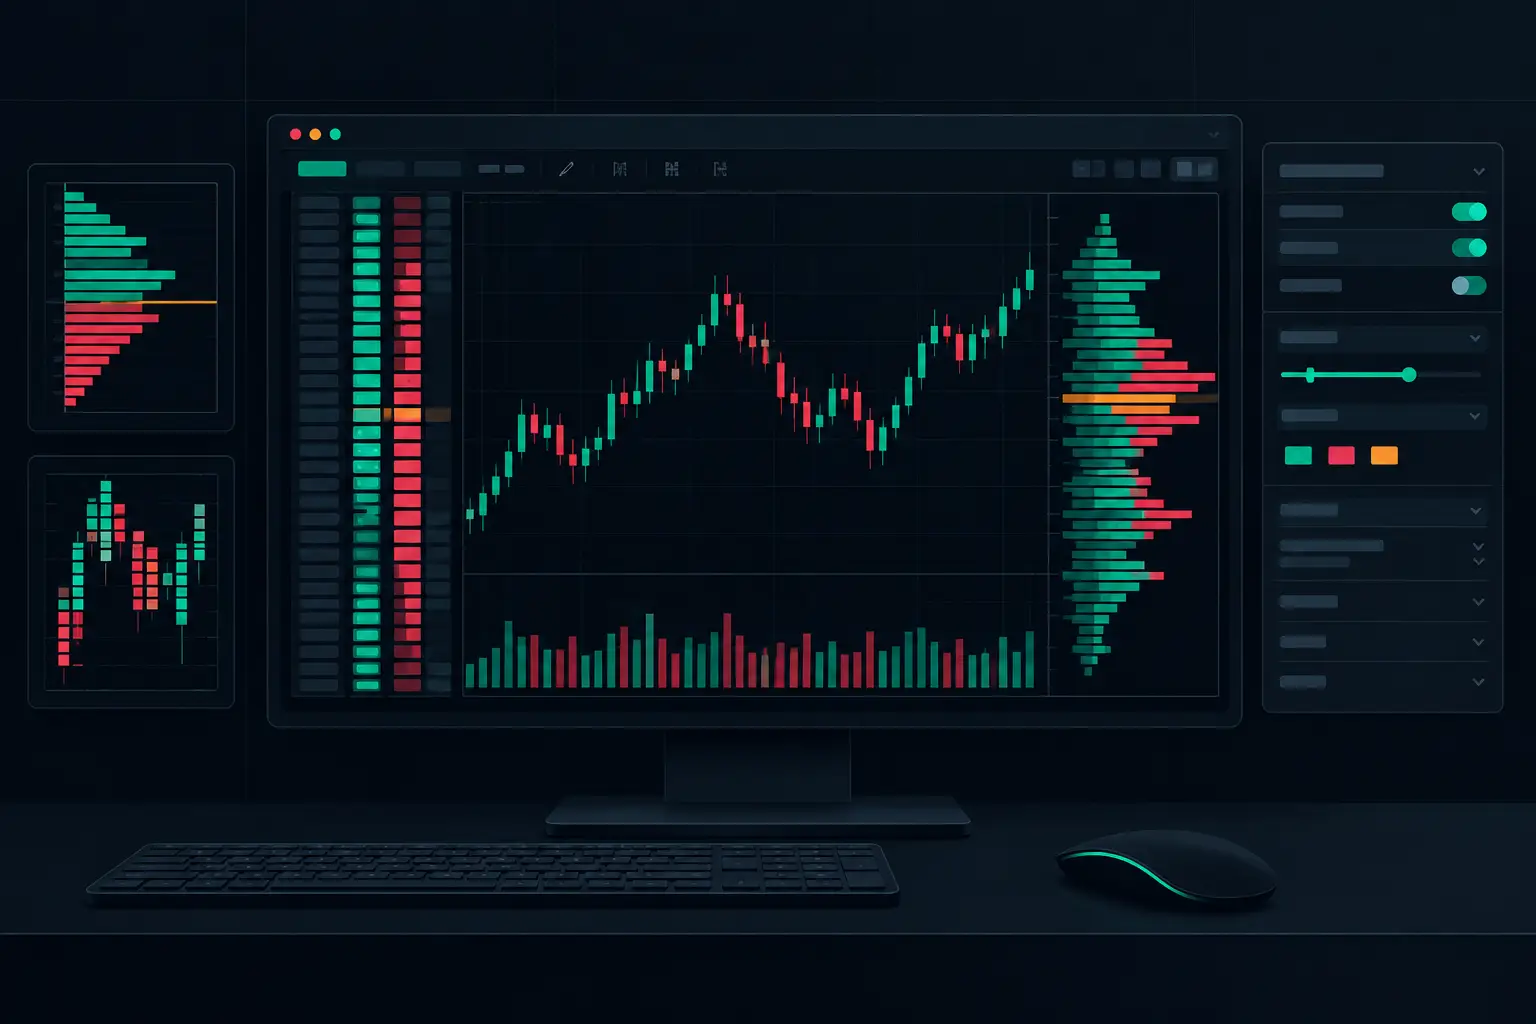
NinjaTrader 8 Order Flow Configuration Setup
Configure NinjaTrader 8 order flow configuration for precise footprint charts, profiles, imbalances, delta, and fast real-time market context on tape.
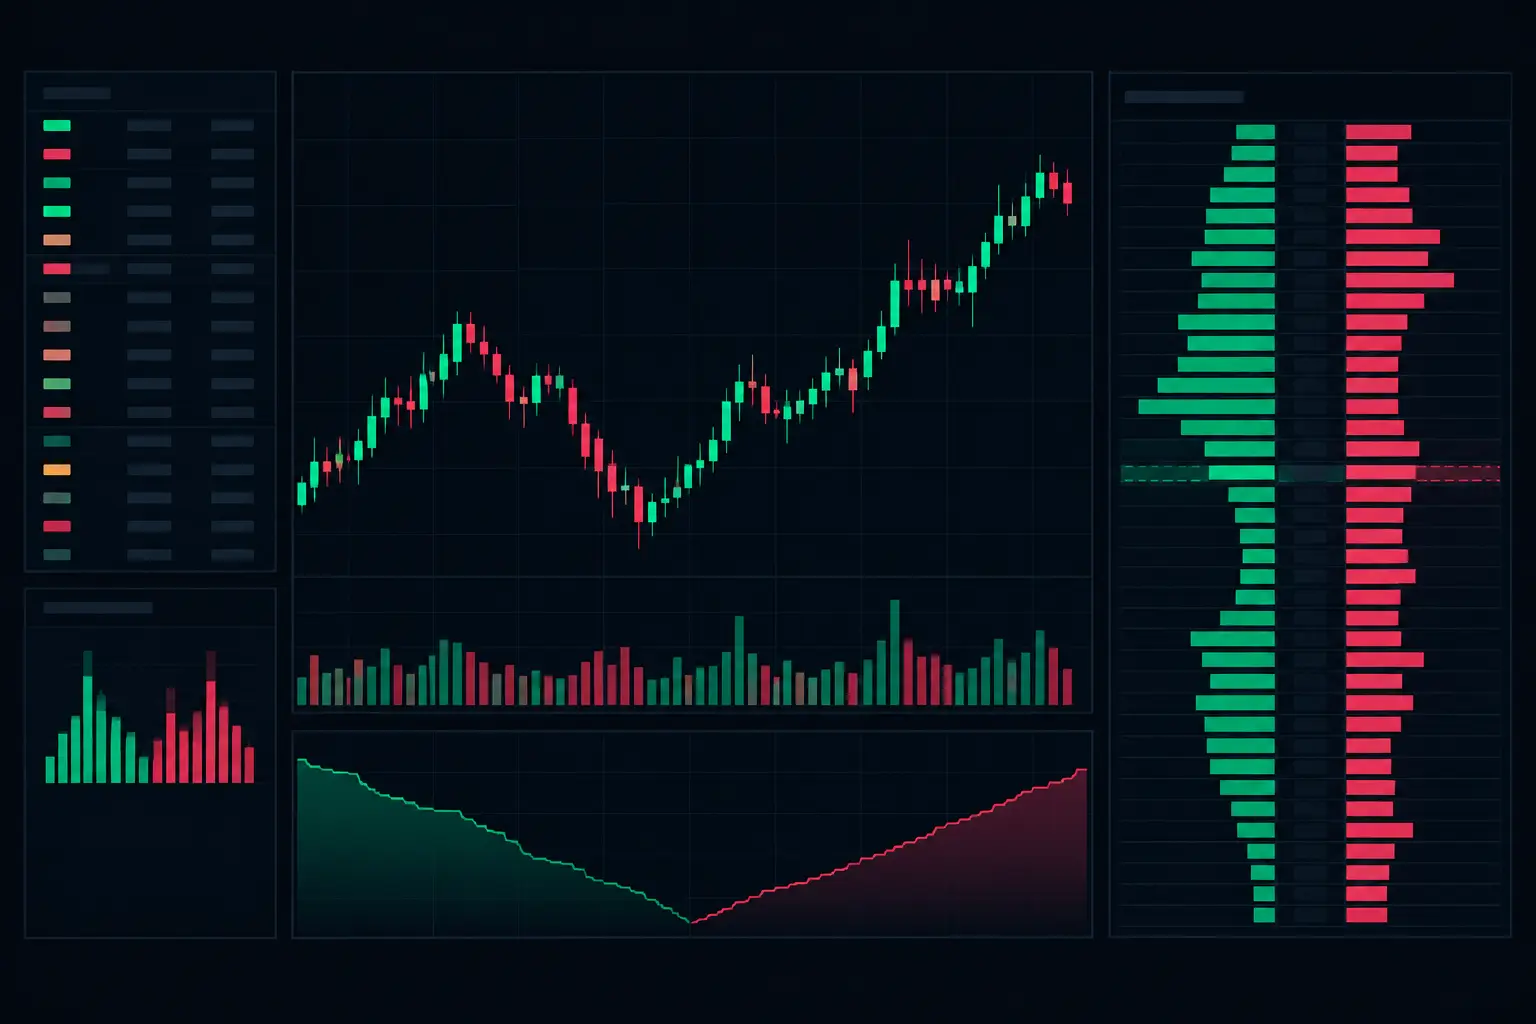
E-mini Bid Ask Visualization That Holds Up
See E-mini bid ask visualization at each price level, with footprint, delta, imbalances, VPOC, and profiles built for fast NinjaTrader 8 charts in motion.