
NinjaTrader Indicators for Order Flow Control
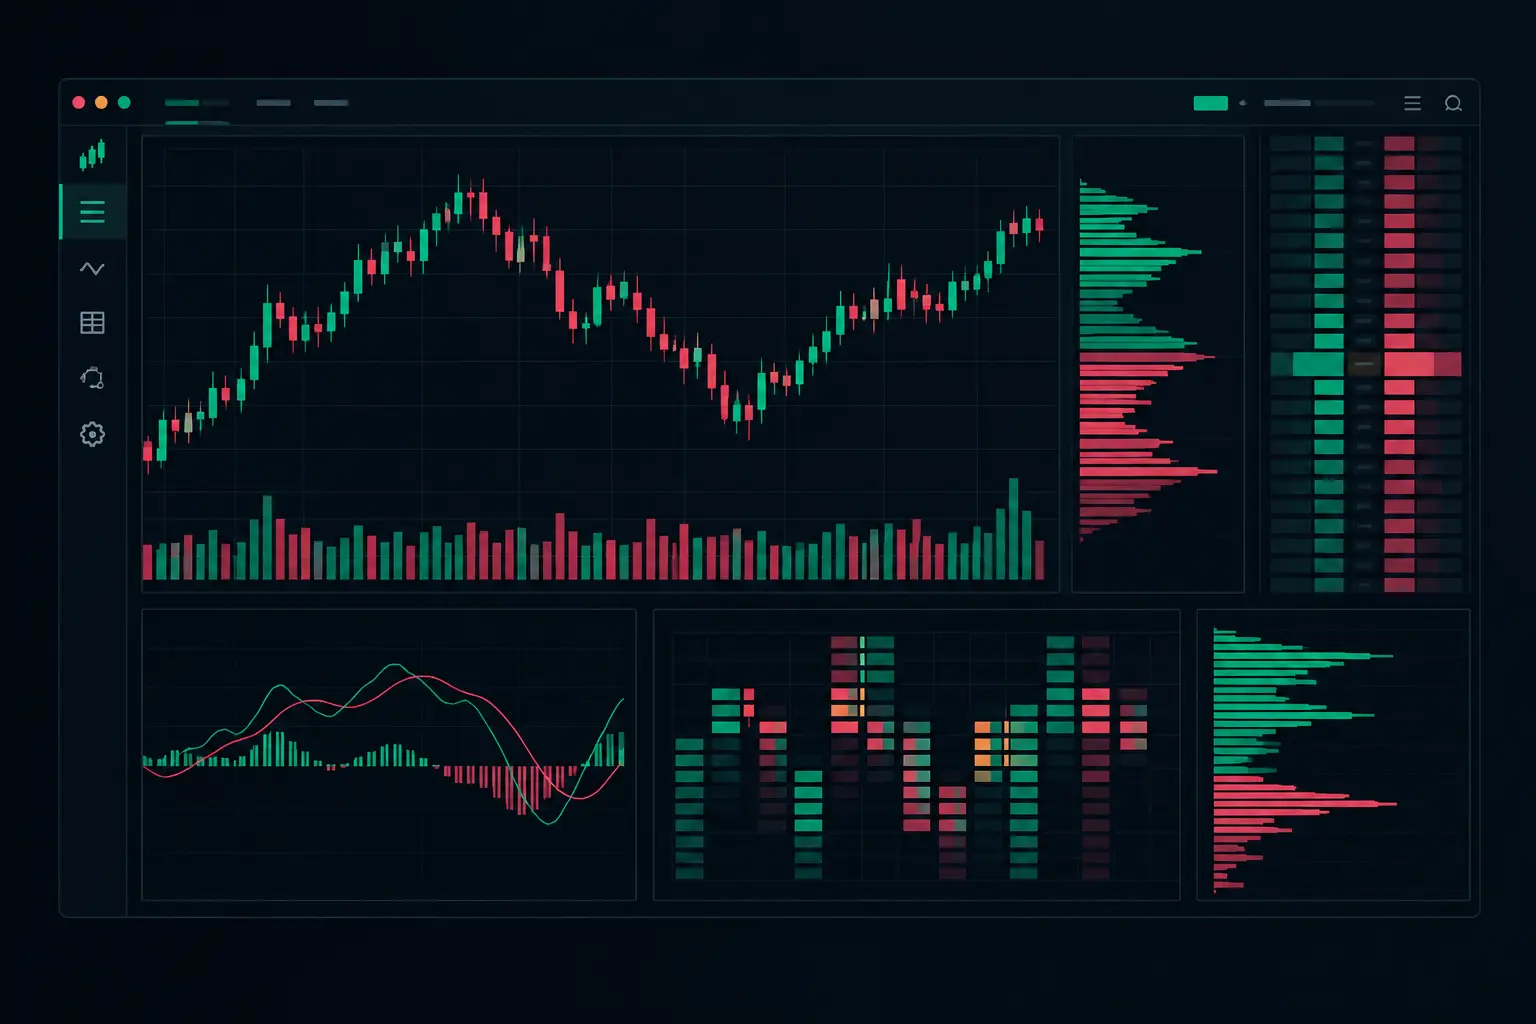
Most traders stare at candles and infer the auction after the fact. Well-built NinjaTrader indicators expose the activity inside those bars: where aggressive buyers lifted offers, where aggressive sellers hit bids, where passive liquidity absorbed the flow, and where volume concentrated at a specific price. That distinction matters when the E-mini S&P 500 futures contract accelerates through several price levels before a conventional bar has closed.
The right workspace is not a pile of studies competing for screen space. It is a coordinated view of bid/ask execution, volume distribution, developing reference levels, and event-based alerts. Each component should answer a different question about the auction without forcing the trader to reconstruct the tape mentally.
What NinjaTrader Indicators Should Reveal
A conventional chart records the result of an auction: open, high, low, close, and total volume. Order-flow-focused NinjaTrader indicators show the composition of that result. Instead of seeing a bar that moved four points, you can inspect which prices carried the volume, whether that volume traded at the bid or ask, and whether participation expanded or faded as price moved.
This is the foundation of a footprint chart. At every price level, the chart can display bid volume, ask volume, total volume, delta, number of trades, or a custom calculation. The useful question is not whether one display mode is universally best. It is whether the chosen display makes the relevant behavior visually immediate for the instrument, session, and chart interval being studied.
For example, bid x ask volume is often the direct choice for reading initiative activity. Delta emphasizes the imbalance between aggressive buying and selling. Total volume can make auction acceptance and high-participation areas clearer. A trader focused on developing structure may use multiple modes across separate chart panels rather than forcing every measurement into one cell.
The point is control. A footprint should be configured around the information that changes your read of the current auction, not around a preset color scheme.
Build the Chart Around Bid/Ask Data
Footprint analysis begins with the data granularity required to reconstruct activity at the price level. NinjaTrader 8 can process market-by-order and bid/ask activity in real time, allowing a footprint tool to classify executed volume according to the side of the market where it occurred. That classification is what turns a volume bar into order-flow context.
A productive setup starts by deciding how much vertical detail the chart needs. One-tick aggregation gives the most precise view of the auction, particularly in instruments where price moves quickly through nearby levels. It can also create dense bars during active periods. Aggregating two, four, or more ticks can reduce visual noise and bring larger-volume behavior forward. Neither choice is inherently superior. The appropriate setting depends on the instrument's tick size, the chart interval, and how tightly the operator needs to inspect price-level interaction.
Color logic should carry meaning, not decoration. Set separate thresholds for high bid volume, high ask volume, positive delta, negative delta, and relative volume extremes. Use enough contrast to identify pressure immediately, but avoid a palette where every cell is visually urgent. If every number is bright, no number is important.
Text sizing, cell width, row height, histogram placement, and developing-bar behavior deserve the same attention. A chart that is readable during a quiet rotation but collapses into unreadable blocks during the cash open is not configured for real execution conditions. Test the layout when the tape is active, not only on a static historical view.
Read Imbalances in Context
Diagonal imbalance compares ask volume at one price with bid volume one tick below, or bid volume with ask volume one tick above. This comparison reflects how aggressive participation is interacting across adjacent price levels as the auction moves. A stacked imbalance extends that condition through consecutive levels, making directional pressure easier to locate visually.
The threshold is a control, not a universal constant. A lower ratio will mark more events and can be useful in thinner periods. A higher ratio filters the display and reserves emphasis for more pronounced participation. Minimum-volume filters are equally important because a large ratio formed from tiny prints may not carry the same structural weight as one formed with substantial volume.
Imbalances are most informative when paired with location. A cluster appearing into a prior session high, a value-area edge, or a developing VPOC says more than the same cluster in the middle of balanced trade. The footprint provides the transaction detail; profile references provide the auction location.
Add Profile Without Fragmenting the Workspace
Volume profile answers a different question from the footprint. Rather than showing what happened at every price inside each bar, it organizes participation across a chosen range, session, or composite. The VPOC identifies the price with the greatest volume in that profile. Value area defines the portion of volume distribution that contains the selected percentage of activity.
These references should remain visible as the session develops. A developing VPOC can migrate as new volume accumulates, while fixed prior-session levels preserve auction memory. Seeing both prevents a common charting error: treating a static level as though current participation has not changed its relevance.
Independent profile columns are especially useful when one profile must represent the current session and another must represent a larger composite or prior period. The chart remains unified, but the time horizons stay distinct. This is cleaner than opening separate windows and attempting to align their levels manually.
A serious footprint workspace should also support separate profile calculations and display controls. Configure value-area percentage, profile width, placement, opacity, VPOC extension, and session boundaries independently where needed. The purpose is not maximum complexity. It is to keep each reference legible when multiple auction structures overlap.
Use Delta to Separate Pressure From Acceptance
Bar delta is the difference between ask volume and bid volume within a bar. Cumulative delta carries that difference forward across a selected reset period. Both measurements can expose whether aggressive participation is expanding, contracting, or failing to move price as expected.
A positive delta bar with limited upward progress may indicate that aggressive buying met passive sell liquidity. A negative delta bar that cannot extend lower may show the opposite interaction. These are not standalone instructions. They are observations about the relationship between executed aggression and price response.
Absorption and exhaustion tools make this relationship easier to monitor in real time. Absorption focuses on substantial executed volume meeting liquidity with limited directional continuation. Exhaustion focuses on diminishing participation near an auction extreme. Their usefulness depends on parameter discipline: volume thresholds, lookback windows, tick range, and reset behavior should reflect the instrument's normal activity rather than arbitrary defaults.
Use developing bars carefully. Intrabar delta, volume, imbalances, and profile migration can change before the bar closes. That is precisely why real-time visualization matters, but it also means the chart must distinguish developing information from completed structure. Clear formatting for unfinished bars prevents historical assumptions from being applied to live activity.
Configure Alerts for Events, Not Noise
Alerts are most valuable when they reduce screen-scanning without turning the platform into a distraction engine. Relevant conditions may include stacked imbalances, absorption events, exhaustion conditions, delta thresholds, VPOC interaction, or a developing value-area boundary. Text-to-speech can add awareness when attention is on another chart, provided the conditions are selective.
Start with a narrow set of events tied to the structure you actually monitor. Then review how often they occur across different session phases. If an alert fires continuously during normal activity, tighten its thresholds, add a minimum-volume requirement, or limit it to a defined session period. An alert should identify a meaningful change in auction behavior, not narrate every active bar.
Performance Is Part of the Analysis
Order-flow charts are calculation-heavy. Every update can require classifying trades, refreshing footprint cells, recalculating profiles, extending reference lines, evaluating conditions, and rendering a dense visual display. When the tape accelerates, delayed visualization is not a cosmetic issue. It changes what is available to interpret.
Choose tools designed for NinjaTrader 8 real-time workloads and configure them with intent. Avoid loading duplicate studies that calculate similar data independently. Keep separate chart templates for distinct workflows rather than one oversized template carrying every possible metric. SidiFootprint, for example, combines footprint, profile, imbalance, delta, absorption, exhaustion, and alert controls in a single configurable environment, reducing the need to fragment those functions across the workspace.
The final test is simple: can you identify what traded at each price, where participation is concentrated, and whether aggressive flow is being accepted or absorbed before the chart becomes stale or cluttered? When NinjaTrader indicators are configured to answer those questions cleanly, the chart stops being a record of candles and becomes a working view of the auction.
See it on your own chart.
Every Sidi tool is unlocked in the free 14-day demo. Install SidiFootprint in NinjaTrader 8 and load one of the finished color styles to start.
Start free 14-day demo → SidiFootprint features Browse color stylesRelated articles
Footprint Chart Software for Faster Order Flow
Footprint chart software for NinjaTrader 8 shows bid/ask activity, delta, imbalances, profiles, and absorption at every traded price level in real time.
Order Flow Indicator Free Trial for NinjaTrader 8
Use an order flow indicator free trial to test footprint speed, bid/ask detail, profiles, and real-time configuration in NinjaTrader 8 futures markets.
How to Configure Footprint Cell Filters Fast
Configure footprint cell filters to isolate meaningful bid/ask activity, control color thresholds, and keep fast order-flow charts readable at speed.