
Order Flow Indicator Free Trial for NinjaTrader 8
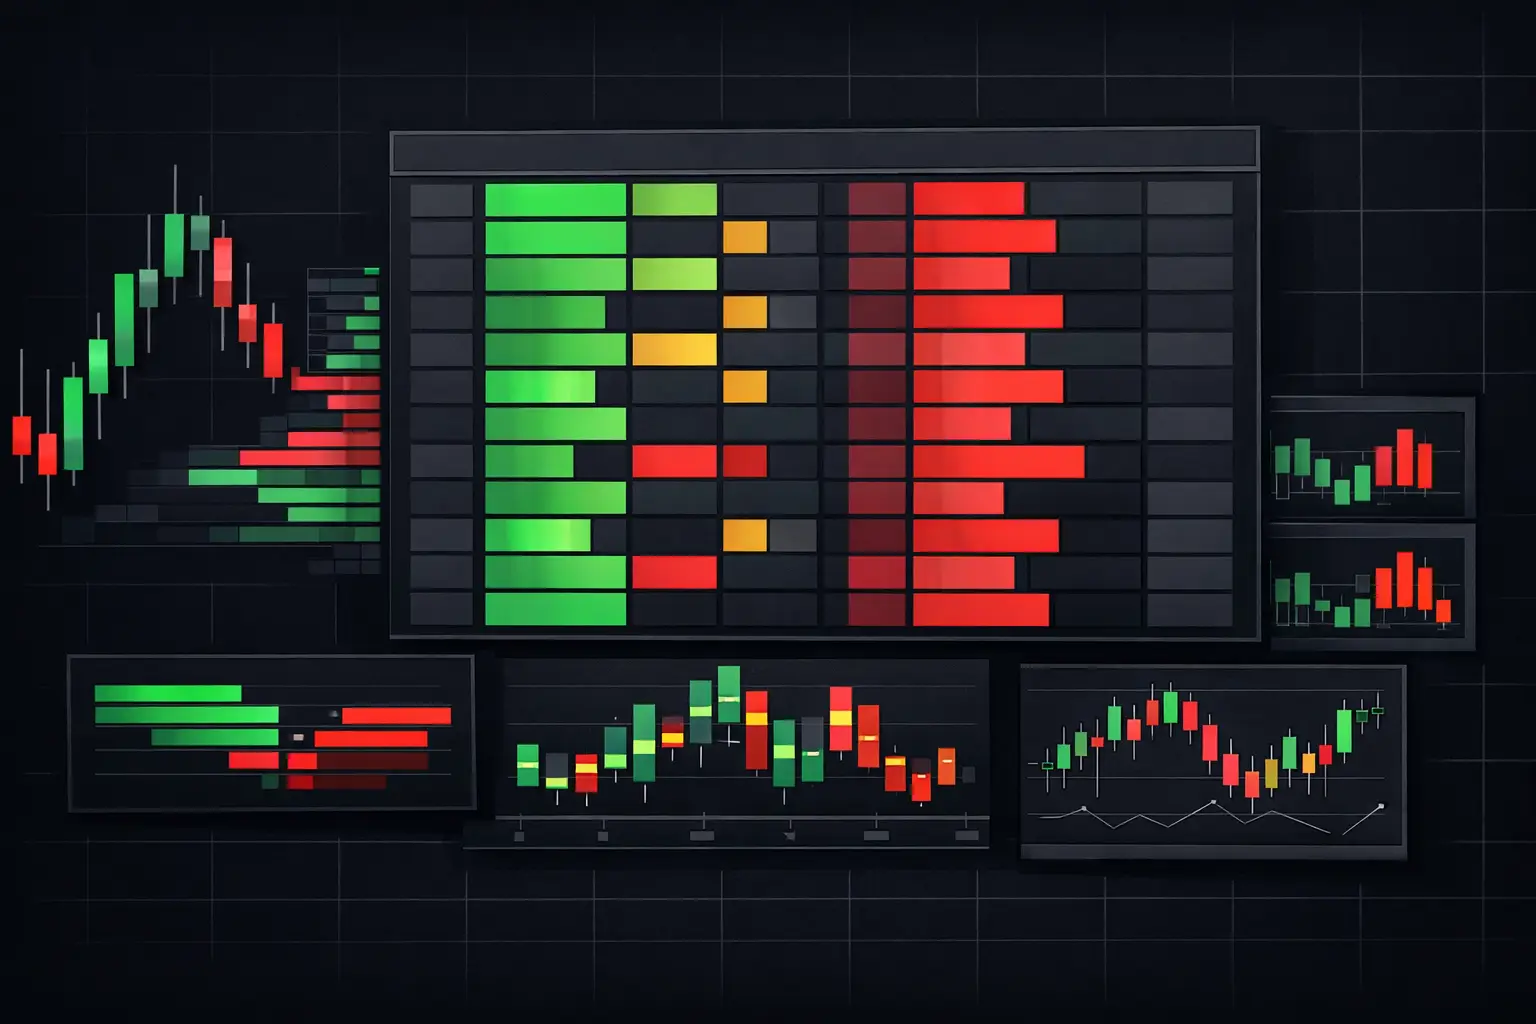
A footprint chart either keeps pace with the auction or becomes another source of delay. When the E-mini S&P 500 is rotating through a high-volume area, a readable bid/ask ladder, a developing VPOC, and visible stacked imbalances have to remain clear as each bar updates. An order flow indicator free trial is the right time to verify that the chart delivers that visibility under live market conditions, not only in a static screenshot.
For an experienced NinjaTrader 8 user, the objective is not to find a prettier candle chart. It is to determine whether the footprint calculation, profile logic, visual hierarchy, and chart controls fit the way you read auction behavior. The best evaluation is structured around your normal workspace, instruments, session templates, and data feed.
What an Order Flow Indicator Free Trial Should Prove
A meaningful evaluation should answer a narrow question: can this tool show what actually traded at each price without forcing you to rebuild your workflow around its limitations?
Start with the footprint itself. Bid volume, ask volume, total volume, delta, and trade count should be selectable and legible at the price level. A footprint that only looks useful at one zoom level will not hold up during an active session. Change bar width, font sizing, row height, color thresholds, and background treatment. The information should remain ordered when bars compress, expand, or develop in real time.
Then test how the indicator handles the context around the footprint. A single number at a price level is rarely enough. You need to see whether aggressive participation is occurring into an established value area, away from the developing VPOC, or at the edge of a session range. Volume profiles, value areas, and session statistics should belong on the same charting surface instead of becoming separate windows competing for attention.
SidiFootprint is designed for that depth of control in NinjaTrader 8. Its footprint, profile, delta, imbalance, absorption, exhaustion, alert, and text-to-speech functions can be configured within one execution-focused workflow. The full-version 14-day demo lets you test the actual feature set rather than a reduced display mode.
Build the Evaluation Around Live Auction Structure
Install the indicator on a workspace you already use. Select an instrument and bar construction that match your routine, whether that is time-based, tick-based, range-based, or volume-based. The point is not to create an idealized chart. It is to expose the tool to the same conditions where you need fast interpretation.
Begin with a clean footprint. Set the display to bid x ask volume and observe how the ladder populates from the open through the first established balance. Look for stable alignment at every price row and for bars that develop without flicker or delayed redraw. In a fast sequence, you should be able to distinguish changing participation from a display simply catching up.
Next, enable delta. Bar delta provides the difference between ask-side and bid-side volume for the bar, while cumulative delta carries that measure across a defined period. These are related views, but they answer different structural questions. Bar delta can highlight immediate aggression within a developing bar. Cumulative delta helps frame whether sustained aggressive activity is building or fading across a larger auction sequence.
Do not evaluate either metric in isolation. Compare it with the location of price, the local volume concentration, and the pace of trade. A positive delta at a session high carries different context than the same delta inside a balanced area. The trial period should show whether your chart layout makes those distinctions immediately visible.
Test diagonal imbalance logic at the price level
Diagonal imbalances are one of the first calculations worth checking closely. An ask volume at one price is compared with bid volume one tick below it; a bid volume is compared with ask volume one tick above it. That diagonal comparison aligns aggressive activity with the opposing side of the ladder.
Use several imbalance ratios and minimum-volume filters during the trial. A lower threshold can expose more activity but may create visual noise in thinner periods. A higher threshold can isolate stronger events but may omit useful detail during quieter rotations. There is no universal setting. The relevant test is whether the control can be tuned to the liquidity and volatility characteristics of the instrument.
Also enable stacked imbalance identification. A sequence of qualifying imbalances across consecutive price levels carries more structural weight than a lone highlighted cell. The chart should make the stack obvious without obscuring nearby volume, delta, or profile levels. Color intensity, text color, cell fill, and stack length controls matter because a setting that works for a compressed chart may not work for an expanded one.
Pressure, Absorption, and Exhaustion Need Separate Views
Order flow tools become less useful when every event is painted with the same color and assigned the same meaning. Aggression, absorption, and exhaustion are distinct conditions, and a trial should test whether the indicator can separate them visually and logically.
Absorption occurs when aggressive market activity meets resting liquidity and price does not continue as expected. On a footprint, this can appear as substantial traded volume or delta at a level while price acceptance fails to extend. The useful question is not whether a colored marker appears. It is whether the marker can be filtered, positioned, and read alongside the footprint and profile context.
Exhaustion is different. It concerns a reduction or termination of participation near an auction extreme. You may want to display it with a minimum volume condition, a delta condition, or a specific visual treatment that does not conflict with imbalance highlighting. Test these features during both active and slower periods. A detector that is visually clear in one pace of market may need a different threshold in another.
This is where extensive configuration becomes practical rather than ornamental. SidiFootprint offers more than 1,000 configuration options because a footprint workspace often has to serve several functions at once: reading current bid/ask interaction, tracking the session profile, marking imbalances, and preserving clean developing bars. A single fixed template cannot fit every chart density or session type.
Evaluate Profile Controls, Not Just Footprint Cells
A footprint tells you where transactions occurred inside a bar. A profile explains where the auction is organizing volume across a wider segment. During the demo, test session profiles and composite-style views alongside the footprint rather than treating them as separate studies.
The VPOC should be easy to distinguish as it develops and after the session is complete. Check whether you can control its line style, extension behavior, labeling, and visibility independently from value area boundaries. Then test the value area calculation and display. If the chart is dense, the profile should add location without covering the price-level information that matters most.
Dual independent profile columns are especially useful when you want two profile perspectives on the same chart. For example, one column can provide a session-oriented view while the other supplies a separate volume distribution. Independence matters: each column needs its own calculation range, width, placement, color treatment, and display logic. Otherwise, the second profile is only a duplicate decoration.
Check profile behavior at session transitions as well. A tool should respect the session template you selected and maintain clean boundaries between one auction and the next. Developing references need to update in a controlled way while completed references remain readable for comparison.
Stress-Test Speed and Chart Legibility
Do not spend the entire trial adjusting colors. First establish that the indicator processes and draws efficiently in a loaded workspace. Run the footprint with the studies you actually use, include multiple chart tabs if that reflects your setup, and observe behavior during periods of increased message flow.
A high-performance footprint is not only about raw calculation speed. It is about retaining legibility while the data updates. Watch for text overlap, delayed profile updates, disappearing markers, or a chart that becomes hard to navigate after several hours of data. Pan backward, change compression, alter bar spacing, and reload the workspace. These basic actions reveal whether the tool stays stable beyond the initial setup.
Use alerts and text-to-speech selectively during this test. Their value is operational: they can call attention to a configured market event while you are focused on another chart. The key is precise filtering. Test alert conditions against your imbalance, absorption, or exhaustion definitions, then make sure the notification behavior is controlled enough to avoid constant interruption.
Configure for Recognition, Not Decoration
The final part of an order flow indicator free trial is reducing the chart to the information you can recognize at a glance. Keep visual roles consistent. For example, reserve one color family for ask-side dominance, another for bid-side dominance, and separate treatments for profile references and exceptional conditions. If every setting competes for emphasis, the chart stops communicating structure.
Save more than one template when your instruments or time horizons differ. A compact intraday footprint may need smaller rows, tighter profile columns, and higher imbalance filters. A wider chart for reviewing session development may benefit from larger cells and more persistent reference lines. Configuration control is valuable when it can be retained and recalled without rebuilding the workspace.
At the end of the trial, the useful result is a chart you can read under normal market pace: bid and ask interaction at each price, delta in context, profile structure beside the bar, and event detection configured to your definitions. That is the standard worth testing - not whether the footprint looks sophisticated, but whether it keeps the auction visible when the tape is moving.
See it on your own chart.
Every Sidi tool is unlocked in the free 14-day demo. Install SidiFootprint in NinjaTrader 8 and load one of the finished color styles to start.
Start free 14-day demo → SidiFootprint features Browse color stylesRelated articles
NinjaTrader Indicators for Order Flow Control
NinjaTrader indicators turn bid/ask activity into real-time chart context. Configure footprint, profile, delta, and alerts for active futures markets.
Footprint Chart Software for Faster Order Flow
Footprint chart software for NinjaTrader 8 shows bid/ask activity, delta, imbalances, profiles, and absorption at every traded price level in real time.
NinjaTrader 8 Order Flow Configuration Setup
Configure NinjaTrader 8 order flow configuration for precise footprint charts, profiles, imbalances, delta, and fast real-time market context on tape.