
NinjaTrader 8 Order Flow Configuration Setup
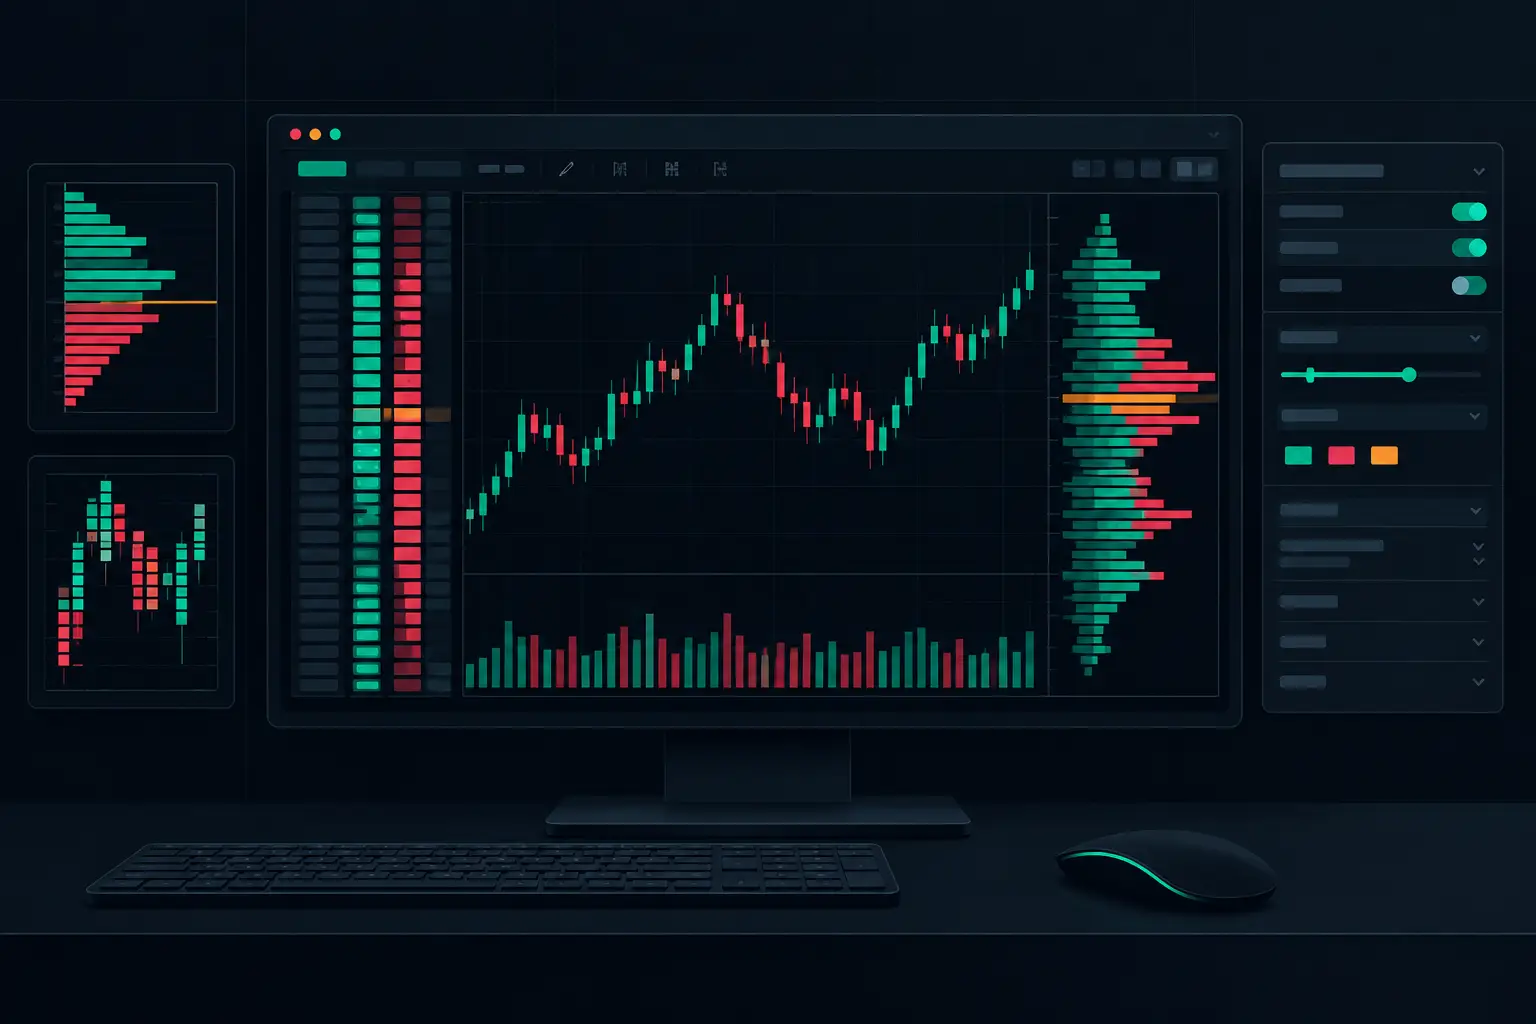
When the E-mini S&P 500 rotates through a reference price and the candle only shows a narrow body, the auction may look quiet. The footprint can show something entirely different: heavy ask-side lifting, passive liquidity absorbing it, and a developing VPOC refusing to move. NinjaTrader 8 order flow configuration determines whether that information is visible, compressed into noise, or missing from the chart altogether.
Most traders stare at candles and guess. A properly configured order-flow workspace shows what actually traded at each price, how aggressive volume was distributed, and where the auction accepted or rejected activity. The objective is not to put every available metric on screen. It is to build a fast, readable chart where bid/ask activity, delta, profile structure, and developing context remain clear when the tape accelerates.
NinjaTrader 8 Order Flow Configuration Starts With Data
A footprint chart is only as precise as the underlying tick data. Bid and ask volume must be available at the price level, with sufficient historical depth for the sessions being analyzed. An OHLC bar cannot be expanded later into accurate bid/ask participation. If the data contains only aggregate volume, delta, diagonal imbalance, and trade-count displays will not represent the completed auction.
Start by confirming that the instrument uses the correct tick size and that the chart is loading the intended session template. On ES, a regular trading hours view and a nearly 24-hour session produce materially different profiles, opening references, and cumulative delta resets. Neither is universally correct. The configuration should match the auction period being examined.
Historical and real-time behavior also need to be checked separately. A chart may look complete after a reload while a developing bar behaves differently during the session because of calculation timing, chart refresh settings, or available tick history. Verify the configuration while the bar is building, not only after it has closed.
Define the Session Before Adding Studies
The session boundary controls more than visual separation. It determines where session profiles begin, when cumulative delta resets, and how opening activity is contextualized. For an RTH-focused ES chart, keep the session template and profile reset aligned. For an overnight auction view, use a template that preserves the full sequence rather than stitching incompatible profile periods together.
Avoid mixing a session profile built on one boundary with cumulative delta built on another unless that difference is intentional and labeled. Small configuration mismatches create false visual relationships between VPOC migration, delta, and price acceptance.
Choose a Bar Type That Matches the Auction
Time bars are useful when the chart must remain synchronized with scheduled market periods and opening rotations. Range bars compress slow periods and expand activity during directional movement. Volume-based construction standardizes the amount of activity in each bar, but it can obscure how long price remained at a level.
There is no superior bar type in isolation. The useful question is whether the bar construction preserves the event being studied. A short time-based footprint can expose absorption during a fast rotation. A larger range footprint can provide cleaner structural context around a multi-point auction. Configure one primary chart first, then add an alternate bar type only when it adds a distinct view of the same instrument.
Keep developing bars visible. Closed bars describe completed activity; a developing bar shows whether the current auction is building volume, shifting delta, or relocating its local VPOC before the interval ends.
Configure Footprint Cells for Immediate Readability
The footprint cell is the core decision point. Bid x ask volume is the standard view when the focus is aggressive participation at every price. Total volume identifies concentration but does not distinguish which side initiated the transaction. Delta expresses the difference between ask and bid volume, while trade count can expose repeated small executions that total volume alone can hide.
A useful layout assigns one primary value to the cell and reserves secondary information for a nearby profile column or concise text field. Trying to display bid, ask, total volume, delta, percentage delta, trades, and multiple markers inside every cell makes fast charts harder to read. Density is not precision.
SidiFootprint supports deeply independent cell, profile, and text controls, allowing the footprint to be organized around the auction rather than a fixed template. Use that flexibility deliberately. Font size, cell width, number alignment, zero-value handling, and contrast colors should be set for the distance at which the chart is actually monitored.
Set Imbalance Logic to the Instrument's Behavior
Diagonal imbalances compare ask volume at one price with bid volume one tick below, or bid volume with ask volume one tick above. This comparison reflects aggression across adjacent prices rather than simply highlighting a large number in one row.
The ratio threshold and minimum-volume filter work together. A low minimum may mark thin, incidental activity. A high minimum can hide meaningful participation during quieter periods. On ES, configure the threshold against normal activity for the selected bar type and session rather than copying settings from a thinner instrument.
Stacked imbalances deserve their own visual treatment because consecutive qualifying prices show persistence, not just a single print. Keep the color hierarchy controlled: one color for ask-side stacks, one for bid-side stacks, and a separate treatment for extreme or filtered conditions. If every threshold produces a bright marker, the chart loses its hierarchy.
Build Profiles Around Location, Not Decoration
A footprint chart becomes more useful when its per-bar activity is connected to profile structure. Configure the bar profile to show local volume concentration and the session profile to show the broader auction. Dual independent profile columns make it possible to place these views side by side without forcing one calculation into the other.
VPOC should be visible but not oversized. It is a reference for the highest-volume price within the selected profile, not a substitute for the profile shape around it. Value area boundaries, developing VPOC movement, and volume distribution provide the surrounding context. A VPOC that remains fixed while price tests away from it describes a different condition than one that steadily migrates with the auction.
Use developing profile settings when intraday context matters. A completed session profile is static. A developing profile shows where volume is currently accumulating and whether the active auction is accepting new prices. Keep session profile colors distinct from per-bar profile colors so the two timeframes remain readable at a glance.
Add Delta, Absorption, and Exhaustion With Clear Rules
Cumulative delta belongs in its own pane or dedicated column when it must be compared with price structure over time. The purpose is to preserve divergence and participation context without crowding the footprint cells. Reset rules must match the selected session, especially when the chart spans overnight and regular trading hours.
Absorption settings should identify substantial aggressive volume meeting passive resistance at a defined price area. Exhaustion settings should identify diminishing participation as price extends. Both require filters based on volume, delta, trade count, price movement, or a combination of these inputs. Broad thresholds produce frequent markings but reduce their meaning; narrow thresholds isolate more specific events but can omit moderate activity.
Text-to-speech and visual alerts are most useful when they are restricted to events that cannot be watched continuously across multiple charts. Tie them to clearly defined conditions such as stacked imbalance, absorption at a session extreme, or a developing VPOC shift. The chart should remain the primary source of context.
Control Performance Before the Open
Fast markets expose inefficient chart layouts immediately. Limit unnecessary calculations, avoid redundant indicator instances, and use a display density that does not force constant redraw pressure. Long historical lookbacks, multiple full-session profiles, and excessive text elements can add visual and processing load without improving the active chart.
Test the workspace with the same instrument, bar type, and session scope used during normal market hours. Check chart scaling, profile-column width, marker overlap, and whether text remains legible when several developing bars print in sequence. A configuration that looks clean on a static chart may become unusable when activity expands.
The strongest order-flow layout is not the one with the most annotations. It is the one where a change in participation, profile location, or aggressive volume stands out immediately because everything else has been configured to stay out of the way.
See it on your own chart.
Every Sidi tool is unlocked in the free 14-day demo. Install SidiFootprint in NinjaTrader 8 and load one of the finished color styles to start.
Start free 14-day demo → SidiFootprint features Browse color stylesRelated articles
Futures Order Flow Visualization Guide for E-mini
Use this futures order flow visualization guide to configure footprint, delta, VPOC, profiles, and imbalance context for fast E-mini auctions each day.
NinjaTrader Indicators for Order Flow Control
NinjaTrader indicators turn bid/ask activity into real-time chart context. Configure footprint, profile, delta, and alerts for active futures markets.
Footprint Chart Software for Faster Order Flow
Footprint chart software for NinjaTrader 8 shows bid/ask activity, delta, imbalances, profiles, and absorption at every traded price level in real time.