
How to Set Footprint Imbalance Thresholds
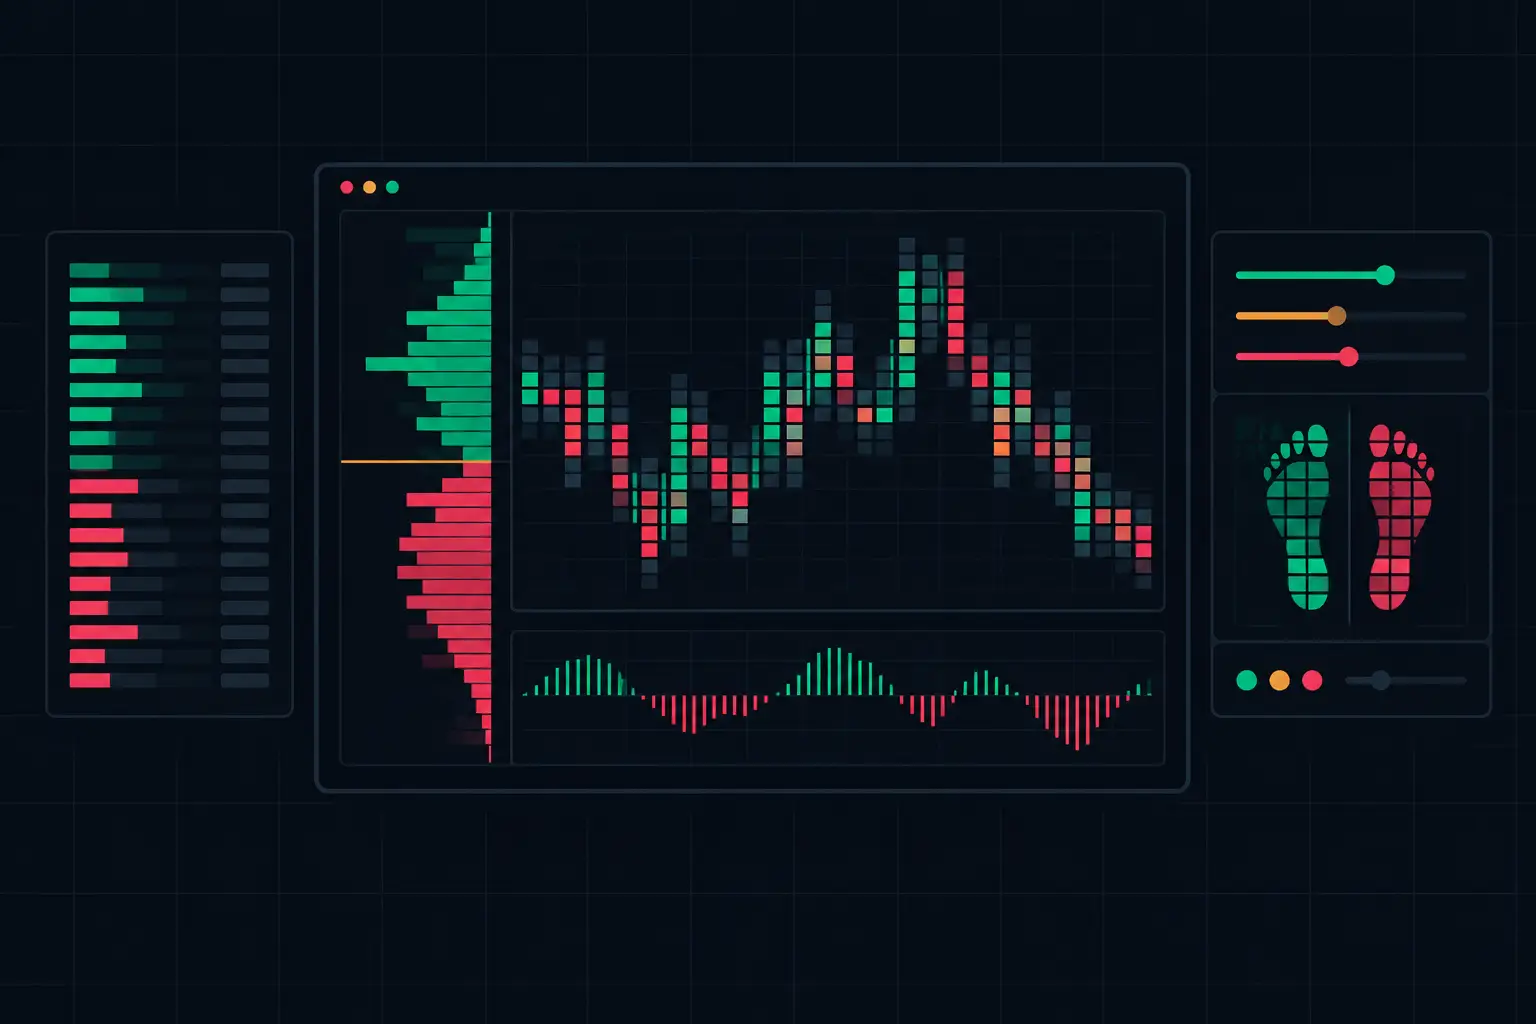
A 3:1 diagonal imbalance can be meaningful in one ES bar and irrelevant in the next. The difference is not the ratio alone. It is the volume behind it, the bar’s location in the auction, and whether aggressive participation persists across prices. To set footprint imbalance thresholds correctly, build a filter that exposes committed order flow without painting every routine print.
Most traders see a colored footprint cell and stop there. A usable imbalance configuration goes further: it distinguishes thin, incidental aggression from participation that changes the structure of the developing bar.
What a Footprint Imbalance Threshold Actually Filters
A diagonal footprint imbalance compares aggressive volume across adjacent price levels. On the ask side, ask volume at one price is compared with bid volume one tick below. On the bid side, bid volume is compared with ask volume one tick above. This diagonal comparison matters because it measures aggression against the opposing side of the auction, not merely volume at the same price.
The imbalance ratio determines how much larger one side must be than the other before the chart highlights the cell. A 3:1 setting means the dominant side must print at least three times the opposing diagonal volume. Lower ratios expose more activity. Higher ratios show only more extreme asymmetry.
That ratio is only half the configuration. Without a minimum-volume condition, a 3:1 relationship such as 15 contracts versus 5 contracts can receive the same visual treatment as 600 versus 200. Both satisfy the arithmetic. They do not carry the same auction weight.
A precise setup therefore uses two controls together: a ratio that defines relative aggression and a minimum threshold that defines absolute participation. The ratio answers, “How one-sided was the print?” The volume threshold answers, “Was there enough activity for that comparison to matter on this instrument and bar type?”
Set Footprint Imbalance Thresholds in the Right Order
Start with the instrument’s normal pace, not with a universal number copied from another chart. ES during the primary US session has a different volume distribution than a quieter overnight period. NQ often prints with different concentration and rotation behavior. A threshold that produces useful structure in one environment can either overpaint or disappear in another.
Establish the ratio before changing the volume floor
Use the imbalance ratio to control selectivity. A lower ratio, such as 2:1, reveals a broad map of aggressive participation. This can be useful when studying rotation inside a narrow balance area, where repeated smaller imbalances may define which side is maintaining pressure.
A higher ratio, such as 4:1 or 5:1, reduces chart noise and isolates more forceful prints. The trade-off is clear: raising the ratio produces cleaner visual output but can hide developing participation before it reaches an extreme condition. Neither setting is inherently superior. The correct setting depends on whether the chart is being used to inspect fine-grained rotation or to isolate only dominant auctions.
Keep the ratio fixed while reviewing several comparable sessions. If you change the ratio and minimum volume at the same time, you cannot identify which control removed or added highlighted cells.
Add a minimum volume threshold that matches the bar
Once the ratio is stable, raise the minimum volume requirement until small diagonal comparisons no longer dominate the chart. This is especially important on smaller aggregation footprints, where many price levels can contain modest volume and still produce mathematically valid ratios.
A minimum threshold should be evaluated relative to the volume typically traded at a price within that bar type. A 500-volume footprint bar and a 5,000-volume footprint bar should not necessarily use the same floor. Likewise, a one-minute bar during a fast opening auction will distribute volume differently from a 15-minute bar during a balanced midday rotation.
Watch what disappears as the floor rises. If isolated, low-participation cells vanish while clusters at active prices remain visible, the filter is moving in the right direction. If whole sections of clearly active auction behavior disappear, the floor is too restrictive for the selected aggregation.
Separate individual imbalances from stacked imbalances
A single imbalance identifies aggression at one price relationship. A stacked imbalance identifies multiple consecutive imbalances in the same direction. These are different pieces of information and should not be treated with the same visual weight.
Set the individual threshold to retain enough detail for the auction to remain readable. Then use a stacked-imbalance requirement to identify persistence. Three adjacent ask-side imbalances are structurally different from one isolated ask-side print, even when the isolated print contains more volume.
The stack count also depends on tick size and bar construction. On a tight range bar, requiring too many consecutive levels can suppress useful structure. On a wider footprint bar, a higher stack requirement can prevent short bursts from receiving disproportionate emphasis. The goal is not to create fewer highlights. It is to make persistent aggression immediately distinguishable from a one-price event.
Use Location to Keep Thresholds Honest
An imbalance threshold has no independent meaning outside location. The same highlighted ask-side sequence can read differently at a prior high, at a developing VPOC, or in the center of a mature balance area.
At the edge of a profile, stacked aggression can show initiative participation pressing into new prices. Near a developing VPOC, the same prints may occur inside two-way trade where volume is being accepted rather than extended. At a session extreme, aggressive volume that fails to move price can be paired with absorption. The footprint identifies what traded. Profile structure and subsequent price response provide the context.
This is why a threshold should be reviewed alongside volume profile, VPOC, value area, delta, and the developing bar. A very strict imbalance filter may look clean in isolation while omitting the sequence that explains why price paused at a high-volume node. A very loose filter may show every fluctuation and obscure the larger auction event.
SidiFootprint supports the level of control required to separate these layers visually. Keep individual imbalances readable, make stacked conditions more prominent, and reserve the strongest color contrast for the participation that deserves immediate attention. If bid and ask imbalances use separate colors, ensure that the palette remains legible when delta, VPOC, and profile columns are visible in the same workspace.
Calibrate for Session Conditions, Not a Fixed Number
A fixed threshold across every hour can distort the chart. The opening auction, scheduled economic releases, and the late session may all produce materially different volume at price. Overnight trade may require a lower absolute volume floor simply because participation is distributed across fewer contracts per level.
That does not mean thresholds should be changed constantly. Frequent adjustment makes historical comparison difficult and encourages configuration drift. A better process is to maintain a small number of purpose-built templates: one for primary-session activity, one for quieter conditions, and one for higher-volume event periods. Each template can retain the same visual logic while adjusting the minimum participation requirement for the environment.
Review completed bars before applying a template to a live developing bar. Look for three conditions: whether meaningful stacks remain visible, whether isolated low-volume comparisons have been filtered, and whether key auction locations still show enough detail to interpret absorption or continuation. This review is faster and more reliable than judging a setting from a single fast sequence.
Common Threshold Errors
The most common error is using ratio without a volume floor. It produces an impressive number of colored cells, but many are created by trivial denominators. Another error is setting the volume floor so high that only the largest prints survive. The chart becomes visually quiet, yet the transition from early aggression to persistent participation is no longer visible.
A third error is applying the same configuration to every bar type. Time-based, volume-based, range-based, and reversal-style bars distribute volume differently across price levels. Thresholds should be tested in the chart construction actually used for auction analysis.
Finally, do not mistake highlighted imbalance for a complete reading. A footprint cell shows executed aggression. It does not independently describe passive liquidity, acceptance, rejection, or absorption. Pair the highlighted print with price movement, cumulative delta, profile position, and the response at the next prices.
A well-set imbalance threshold makes the chart quieter for the right reason: not because information has been removed, but because routine prints no longer compete with the auction behavior that is actually shaping the bar.
See it on your own chart.
Every Sidi tool is unlocked in the free 14-day demo. Install SidiFootprint in NinjaTrader 8 and load one of the finished color styles to start.
Start free 14-day demo → SidiFootprint features Browse color stylesRelated articles
Configure Footprint Cell Metrics for Fast Tape
Configure footprint cell metrics to expose bid/ask pressure, delta, trades, and imbalance structure without burying fast-market auction context in noise.
Horizontal Versus Diagonal Imbalance Detection
Horizontal versus diagonal imbalance detection clarifies bid/ask aggression at each price, giving futures traders clear footprint context in fast auction.
Top Footprint Visualization Settings for Fast Tape
Set top footprint visualization settings for NinjaTrader 8: color logic, imbalance thresholds, profiles, VPOC, and bar clarity in fast futures markets.