
Horizontal Versus Diagonal Imbalance Detection
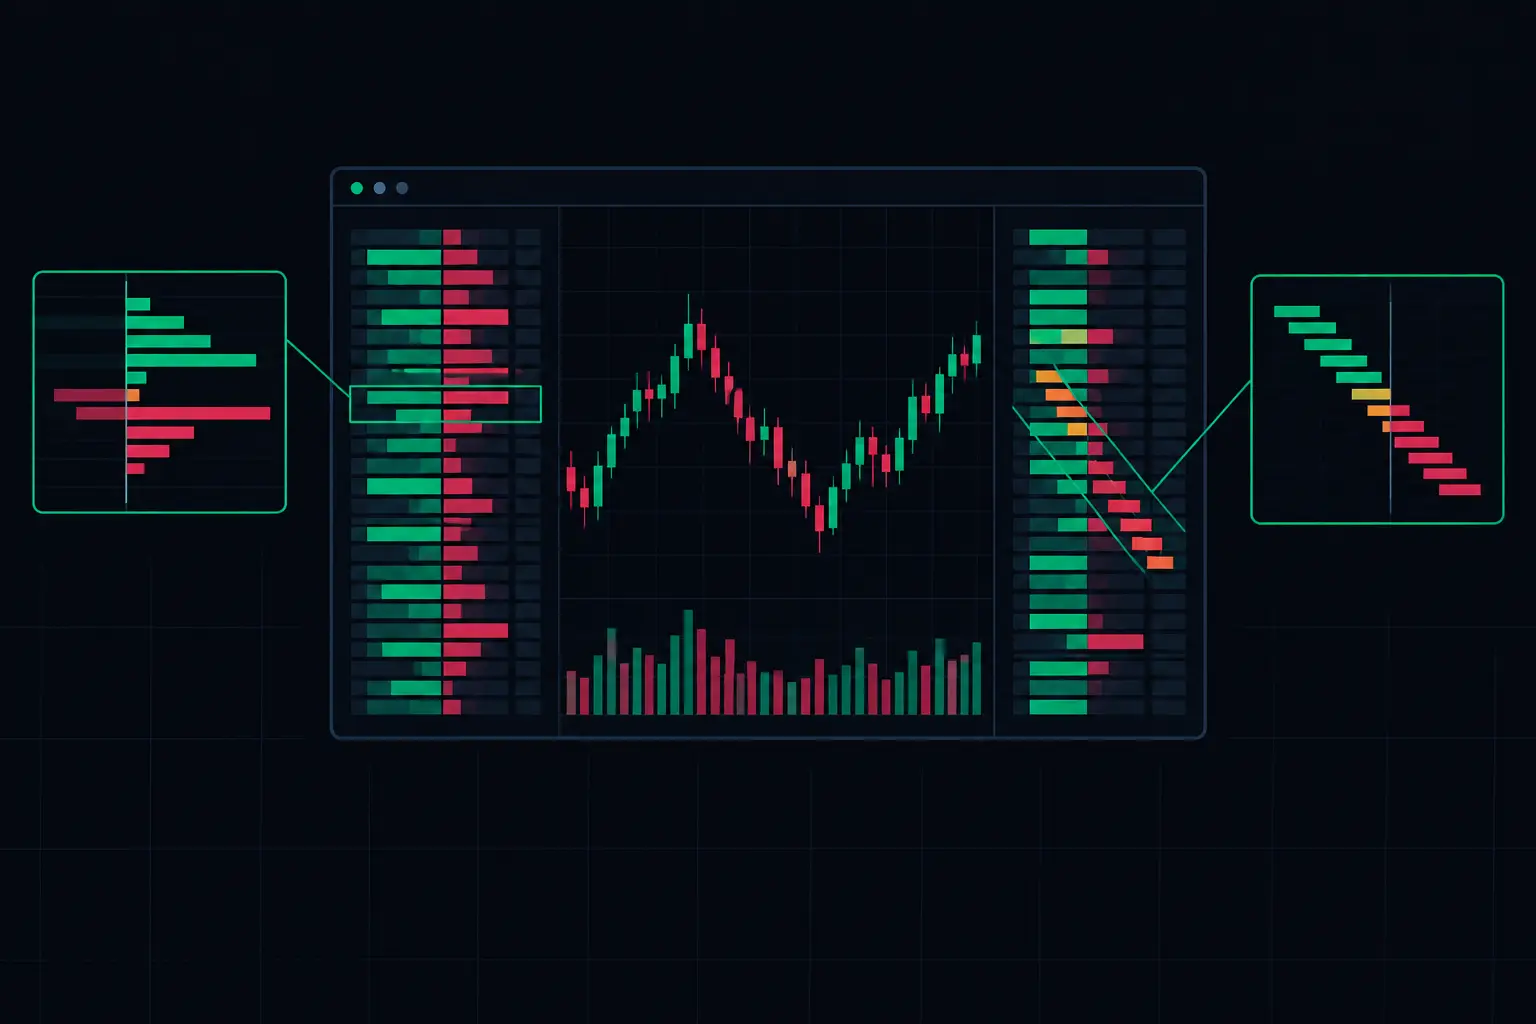
A footprint is only as useful as the comparison behind its color. Horizontal versus diagonal imbalance detection changes what qualifies as aggressive participation at a price level, which changes the auction structure visible inside a developing bar. For active futures traders, the question is not which method is universally better. It is whether the comparison matches the behavior being measured.
A horizontal comparison measures bid and ask volume at the same price. A diagonal comparison measures aggressive volume against the opposing side one tick away. Both can expose one-sided participation. They simply frame that participation through different auction logic.
Horizontal versus diagonal imbalance detection
At every price in a bid/ask footprint, executed volume is classified by the side that initiated the transaction. Contracts lifting the offer print on the ask. Contracts hitting the bid print on the bid. An imbalance highlights a meaningful difference between those two values, usually after a user-defined ratio and minimum-volume filter are met.
Horizontal imbalance detection compares those values on the same row. If 420 contracts trade at the ask and 80 trade at the bid at 5,250.00, the ask-to-bid ratio at that exact price is 5.25:1. If the configured threshold is 4:1, that row qualifies as an ask-side horizontal imbalance.
Diagonal imbalance detection shifts the comparison by one tick. Ask volume at 5,250.00 is compared with bid volume at 5,249.75. Bid volume at 5,249.75 is compared with ask volume at 5,250.00. This structure follows the directional path of the auction: buyers lift offers upward, while sellers hit bids downward.
The arithmetic is simple. The interpretation is not.
What horizontal detection isolates
Horizontal detection asks a narrow question: at this exact price, which aggressor side was dominant? It is a direct read of two-sided activity contained in a single price row. That makes it useful when the chart layout is centered on localized participation, especially around a VPOC, prior session reference, opening range boundary, or a clearly defined volume node.
Because both values belong to the same price, horizontal comparison can reveal intense conflict at a level. Large volume on both sides may show that the auction was active and contested, even when one side satisfies the imbalance threshold. The row still contains the full two-sided exchange.
This is valuable near balance boundaries. A horizontal ask imbalance appearing directly at an upper distribution edge carries different context from the same print in the center of a high-volume area. The footprint does not assign meaning for you. It shows exactly where aggressive execution became disproportionate.
What diagonal detection follows
Diagonal detection is designed around price progression. An ask imbalance compares buying at one level with selling one tick below, while a bid imbalance compares selling at one level with buying one tick above. The comparison aligns with how initiative activity presses through the ladder.
That alignment makes diagonal imbalances particularly effective for displaying directional sequences. When consecutive ask-side diagonal imbalances print from one price to the next, the footprint shows buyers repeatedly lifting offers as price auctions higher. When the sequence extends across multiple levels, it becomes a stacked imbalance - a compact visual record of sustained initiative participation.
The same logic applies on the sell side. Consecutive bid-side diagonal imbalances can show sellers repeatedly transacting into bids lower in the ladder. In a fast ES bar, this pattern is often easier to read than a raw volume column because the ratio filter removes much of the ordinary two-sided flow.
Diagonal comparison is not inherently more accurate. It is more directional. That distinction matters when configuring the chart.
The denominator matters as much as the ratio
An imbalance ratio without a minimum-volume condition can overemphasize small prints. A 10:1 ratio created by 10 contracts versus 1 contract is structurally different from a 10:1 ratio created by 1,000 versus 100. Both satisfy the math. Only one may be large enough to deserve visual priority in the current instrument and session.
Set the ratio and minimum volume together. The ratio defines relative aggression. The minimum defines the activity required before that relative difference is displayed. On a highly active contract, a low minimum can flood the footprint with colored rows. On a thinner contract or quieter session, an oversized minimum can hide the developing structure entirely.
The practical objective is not to produce the most imbalances. It is to make genuine concentration visible immediately.
A useful configuration process is to begin with an imbalance ratio that filters ordinary back-and-forth auction activity, then adjust the minimum volume while observing several full sessions. If almost every row is highlighted, the chart is describing noise. If only isolated extreme prints survive, the threshold may be excluding useful continuity. The right setting preserves meaningful clusters without turning the footprint into a solid block of color.
Reading stacked imbalances in context
A stack is more than several highlighted rows. Its location, length, and relationship to surrounding volume determine what the chart is showing.
A three-level diagonal ask stack pushing out of a low-volume area is different from a three-level stack printing into an established VPOC. In the first case, the auction may be moving through relatively thin participation. In the second, aggressive buying is meeting a location where substantial volume has already accumulated. The footprint can show the initiative flow, while the profile provides the broader distribution context.
This is where integrated volume-profile analytics matter. A stack near a developing value-area edge, a prior VPOC, or session high has structural reference. The same colored sequence in the middle of a balanced distribution may simply be one active rotation inside a larger two-way auction.
Absorption adds another layer. Strong ask-side diagonal imbalances may print repeatedly while price stops advancing. The chart is then showing aggressive buyers executing, but not necessarily clearing the available liquidity above. Conversely, repeated bid-side imbalances that fail to extend lower can reveal heavy selling activity being absorbed at the bid. The distinction comes from the interaction between executed aggression, price progress, and the volume building at the level.
When horizontal detection is the cleaner view
Horizontal imbalances are often the cleaner choice when your focus is exact-price comparison rather than directional continuation. They can make sense when studying a precise response at a reference level, when monitoring whether one side dominated a heavily traded row, or when you want the bid and ask relationship to remain visually self-contained.
They also reduce the conceptual jump of comparing neighboring rows. In a compressed chart where several visual tools already compete for attention, a same-price comparison can be easier to audit quickly. You see the ask and bid that formed the ratio without tracing to the adjacent price.
The trade-off is that horizontal detection may not express upward or downward initiative as naturally as the diagonal model. A horizontal ask imbalance at one level does not directly compare that buying with the selling pressure below it. For traders who organize footprint analysis around auction progression and stacked behavior, that missing directional relationship can matter.
Configure the footprint for the auction you trade
SidiFootprint supports the control needed to treat imbalance detection as a chart-design decision, not a fixed study. Choose horizontal or diagonal comparison, define the ratio, enforce a meaningful minimum, and separate the colors used for ask and bid dominance. The display should remain readable when bars develop quickly, not only after the session is complete.
Keep the visual hierarchy disciplined. Imbalance colors should identify exceptional participation, while delta, total volume, VPOC, value areas, and profile columns provide the surrounding evidence. If every element uses maximum contrast, none of them has priority.
It also helps to preserve comparable settings long enough to learn the behavior of a specific contract. Constantly changing the ratio after every active bar makes the footprint harder to interpret because the definition of exceptional participation keeps moving. Adjust deliberately, then observe how the chosen filter behaves through opening activity, midday rotation, and late-session expansion.
Use the method that answers your question
Horizontal and diagonal imbalance detection are not competing decorations. They are two different measurements of bid/ask aggression. Horizontal comparison isolates dominance at one exact price. Diagonal comparison maps aggression through adjacent prices in the direction of the auction.
When the tape accelerates, that difference determines whether the footprint shows a contested level, a directional sequence, or both. Configure the comparison first, then let the developing bar, profile structure, and executed volume provide the context.
See it on your own chart.
Every Sidi tool is unlocked in the free 14-day demo. Install SidiFootprint in NinjaTrader 8 and load one of the finished color styles to start.
Start free 14-day demo → SidiFootprint features Browse color stylesRelated articles
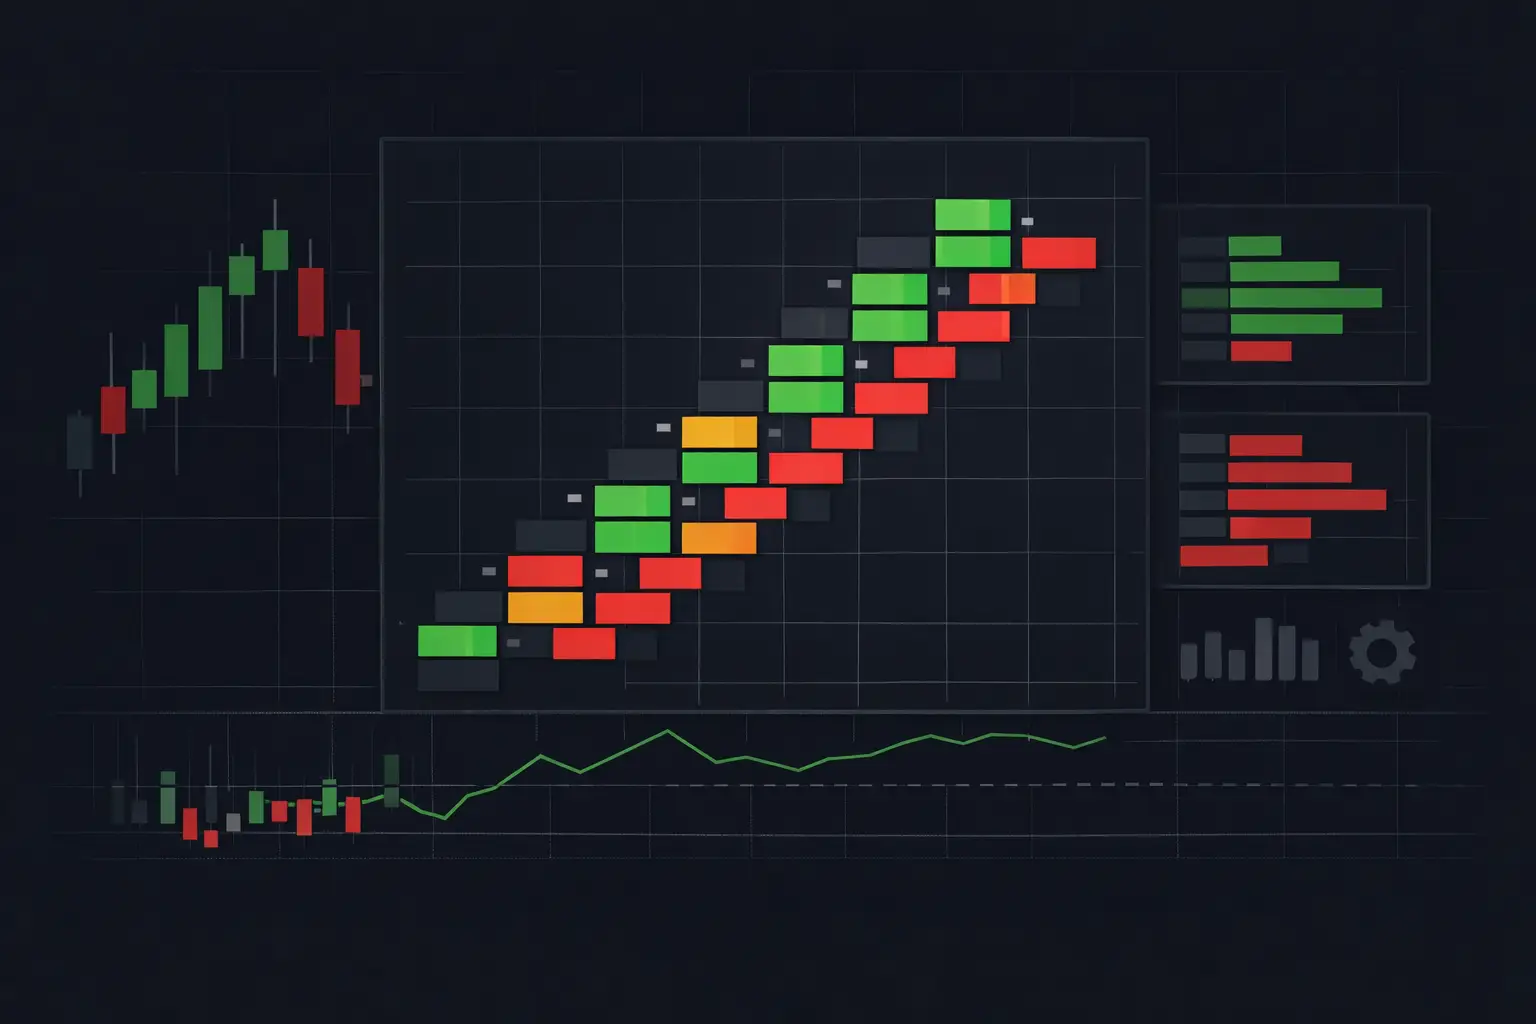
Diagonal Imbalance Footprint Chart Explained
A diagonal imbalance footprint chart exposes aggressive bid and ask activity price by price, giving futures traders precise auction context in real time.
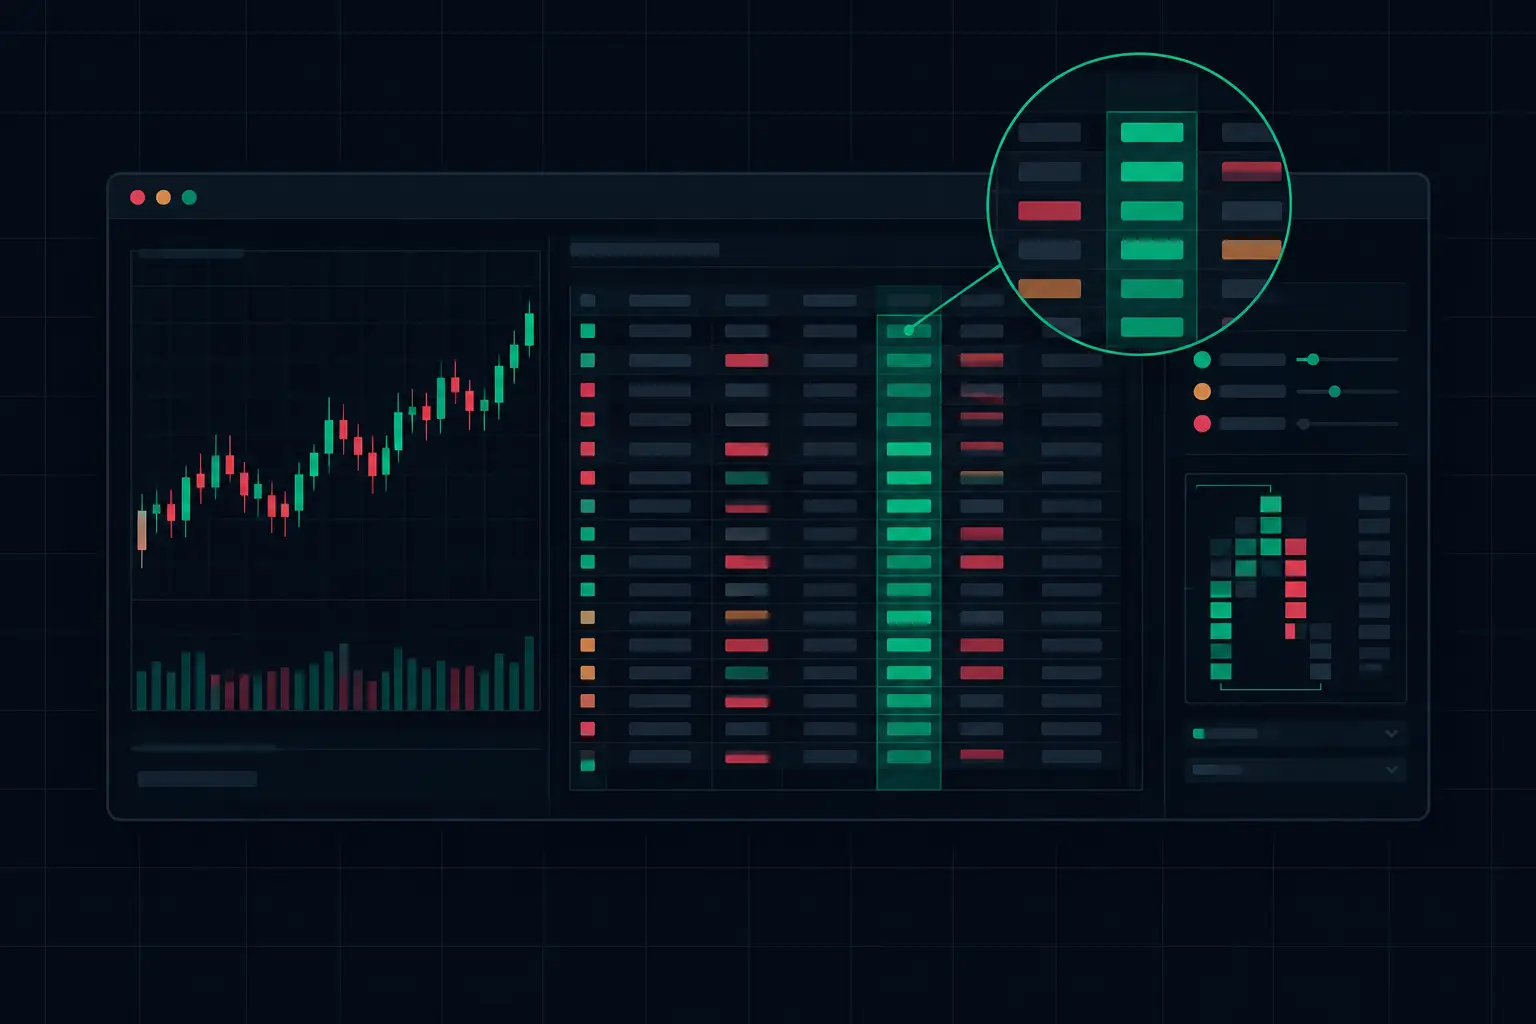
Configure Footprint Cell Metrics for Fast Tape
Configure footprint cell metrics to expose bid/ask pressure, delta, trades, and imbalance structure without burying fast-market auction context in noise.
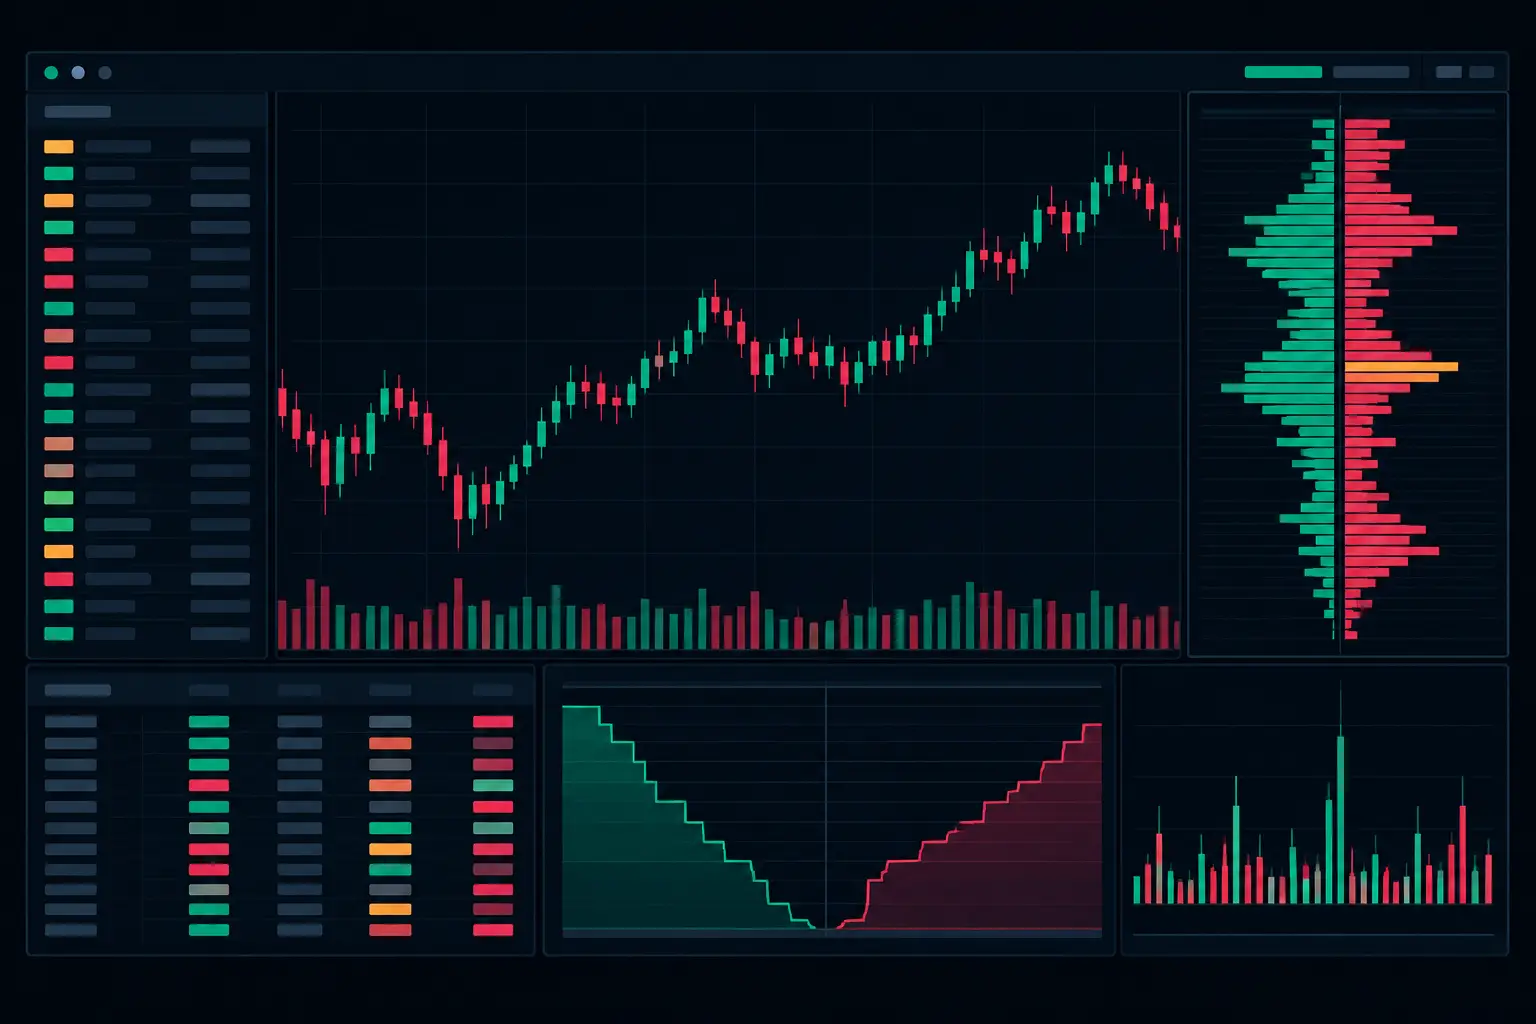
Futures Order Flow Visualization Guide for E-mini
Use this futures order flow visualization guide to configure footprint, delta, VPOC, profiles, and imbalance context for fast E-mini auctions each day.