
Configure Footprint Cell Metrics for Fast Tape
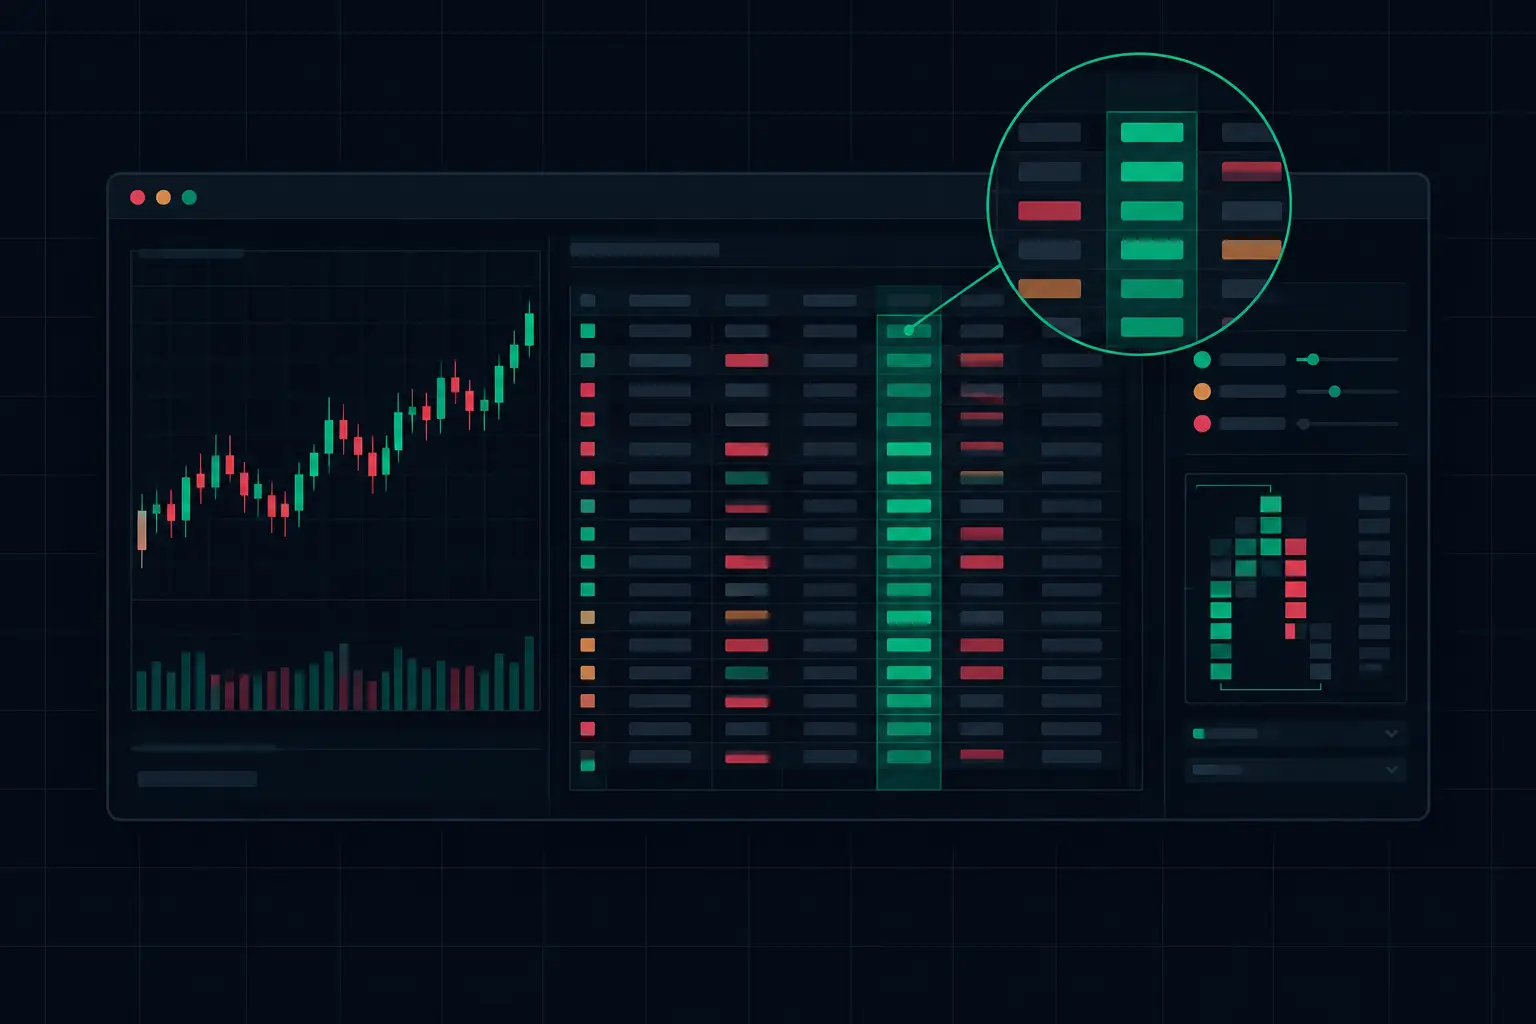
A footprint is only as useful as the metrics visible inside each price cell. Configure footprint cell metrics with the wrong hierarchy and an active ES auction becomes a wall of changing numbers. Configure them with a clear purpose, and each developing bar shows where aggressive volume traded, where delta expanded, where stacked imbalance formed, and where participation failed to move price.
The objective is not to display every available calculation. It is to build a cell layout that can be read at tape speed while preserving the context needed to interpret the auction.
Start With the Question Each Cell Must Answer
A footprint cell should answer one primary question immediately: who was aggressive at this price? Bid volume shows contracts executed against the bid. Ask volume shows contracts executed against the ask. Their difference is delta. Together, these values expose the interaction that a conventional candle compresses into open, high, low, and close.
The first configuration decision is therefore whether the cell should emphasize raw participation, directional aggression, or a comparison between neighboring prices. Those are different jobs. Trying to make one number do all three usually creates visual noise.
For a fast intraday chart, bid x ask is often the clearest baseline. It preserves the actual executed volume on both sides and makes diagonal comparisons intuitive. A 40 x 240 cell, for example, has very different auction character from a 140 x 140 cell even though the total volume is identical. The first shows concentrated ask-side aggression. The second shows two-sided trade.
Delta is the next useful layer, but it works best when it is not forced to replace bid and ask. Delta can quickly identify where one side dominated a price level. Bid x ask tells you whether that delta came from a large ask print, a thin opposing bid, or meaningful volume on both sides.
Configure Footprint Cell Metrics by Chart Role
A scalper's developing bar and a wider intraday context chart do not need the same cell density. The chart interval, instrument volatility, and screen space determine how much numerical detail remains readable.
The execution chart: preserve bid and ask detail
On a short-interval ES chart, use bid x ask as the primary cell metric. Keep the numbers aligned consistently, with bid on the left and ask on the right, so the eye never has to decode a changing layout. Add delta as a secondary value only when the font size and bar width remain clean during expansion.
This configuration is particularly effective when reading diagonal imbalance. Diagonal imbalance compares ask volume at one price with bid volume one tick below, or bid volume with ask volume one tick above. That comparison follows the path of aggressive lifting and hitting through the ladder rather than comparing two values at the same price.
If diagonal imbalance is central to the chart, do not crowd the cell with redundant totals. Let the imbalance color do its job while the bid x ask values provide verification. A strong colored sequence backed by expanding ask volume is structurally different from a colored sequence formed on small prints.
The context chart: emphasize delta and volume structure
For a larger rotation or session-level view, delta and total volume can carry more value than every individual bid and ask print. Here, the cell must reveal where the auction accepted volume and where directional aggression concentrated within the bar.
Use a delta-centered layout when you need to scan multiple bars for expansion, divergence, or a shift in participation. Pair it with volume-based shading or histogram logic so a large delta does not visually outweigh a more meaningful high-volume price.
This is also where cumulative delta belongs as a companion study rather than a replacement for cell metrics. Cumulative delta describes the running imbalance of aggressive activity across the selected period. The footprint identifies the precise prices that produced it.
Build a Visual Hierarchy, Not a Color Contest
Cell metrics are read first through position and contrast, then through the number itself. If every value has a bright color, bold font, gradient background, and threshold marker, nothing is prioritized. Fast auctions punish clutter.
Set one primary layer and one exception layer. For example, bid x ask can remain in neutral text while qualified imbalances receive directional color. Or delta can be the primary text while unusually large total volume receives background intensity. The exception layer should be reserved for information that changes how you read the bar.
Thresholds should be instrument-specific and based on normal activity, not arbitrary round numbers. A threshold that is useful during a quiet midday ES rotation may be too low during the opening sequence. When possible, use relative logic or adjust the threshold to the chart's purpose and current liquidity conditions.
Color intensity should also reflect magnitude rather than merely direction. Light shading can identify a qualified imbalance, while deeper shading can distinguish materially larger participation. Keep positive and negative colors stable across the workspace. If ask-side aggression is one color on the footprint, it should not represent the opposite condition on a profile or delta study.
Use Minimum Filters to Remove Meaningless Prints
Not every price level deserves equal visual weight. A footprint bar can contain small, mechanically unimportant prints around the active auction. Minimum volume filters and imbalance thresholds help prevent those cells from competing with meaningful participation.
The trade-off is straightforward. Aggressive filtering produces a cleaner chart but can hide early shifts in activity. Loose filtering preserves every detail but makes developing bars harder to read. The appropriate setting depends on whether the chart is used to inspect microstructure at a narrow range or to monitor a broader intraday auction.
A practical approach is to begin with a visible threshold that removes only the smallest recurring prints. Then evaluate the chart during both compressed and expanding conditions. If colored cells appear almost continuously, the threshold is too permissive. If only extreme events remain visible, it may be masking the sequence that built into them.
Avoid treating a single threshold as permanent. Contract behavior changes with time of day, scheduled events, and the session's current range. Your cell configuration should be stable enough to read instinctively but flexible enough to remain proportionate to the tape.
Keep VPOC and Profile Data Outside the Cell When Possible
The footprint cell is not the place to force every volume-profile calculation. VPOC, value area, session profile, and bar profile answer broader location questions. They become less useful when compressed into the same visual space as bid/ask numbers.
Place VPOC and value-area references where they remain visible across the chart, then use the footprint cells to inspect the trade occurring around those references. A high-volume node can show acceptance, but the bid/ask interaction at that node reveals whether activity is balanced, aggressively one-sided, or absorbed.
Dual independent profile columns are especially useful when one column carries session volume structure and the other carries delta or another order-flow measure. This separates location from participation. You can see where volume accumulated and, independently, how aggressive activity developed there.
Validate the Layout on Developing Bars
A configuration that looks clean after the fact can fail when the bar is still building. Test cell metrics while values update in real time. Watch whether the primary information remains legible as the bar expands, whether colors flicker excessively around thresholds, and whether important levels can be found without pausing to decode the display.
SidiFootprint provides enough configuration depth to build distinct layouts for different chart roles rather than forcing one compromise template across the workspace. Keep those layouts purposeful. A compact bid x ask chart, a delta-focused context chart, and a profile-oriented session chart can each show a different layer of the same auction without duplicating the same visual workload.
A Practical Metric Stack for ES Footprints
For traders who need a controlled starting point, build the footprint around four layers: bid x ask as the core cell read, diagonal imbalance as the exception marker, delta for directional confirmation, and VPOC or session profile for location. Each layer has a separate task, which keeps the chart readable when activity accelerates.
Then adjust one variable at a time. Change the imbalance ratio, minimum volume, text size, or color intensity, and observe the effect over a full range of market conditions. Changing all four at once makes it impossible to know which adjustment improved the read.
The best footprint configuration is not the one with the most visible calculations. It is the one that lets you locate aggressive participation, absorption, exhaustion, and accepted volume at the exact price level before the next developing bar fills the screen.
See it on your own chart.
Every Sidi tool is unlocked in the free 14-day demo. Install SidiFootprint in NinjaTrader 8 and load one of the finished color styles to start.
Start free 14-day demo → SidiFootprint features Browse color stylesRelated articles
NinjaTrader 8 Order Flow Configuration Setup
Configure NinjaTrader 8 order flow configuration for precise footprint charts, profiles, imbalances, delta, and fast real-time market context on tape.
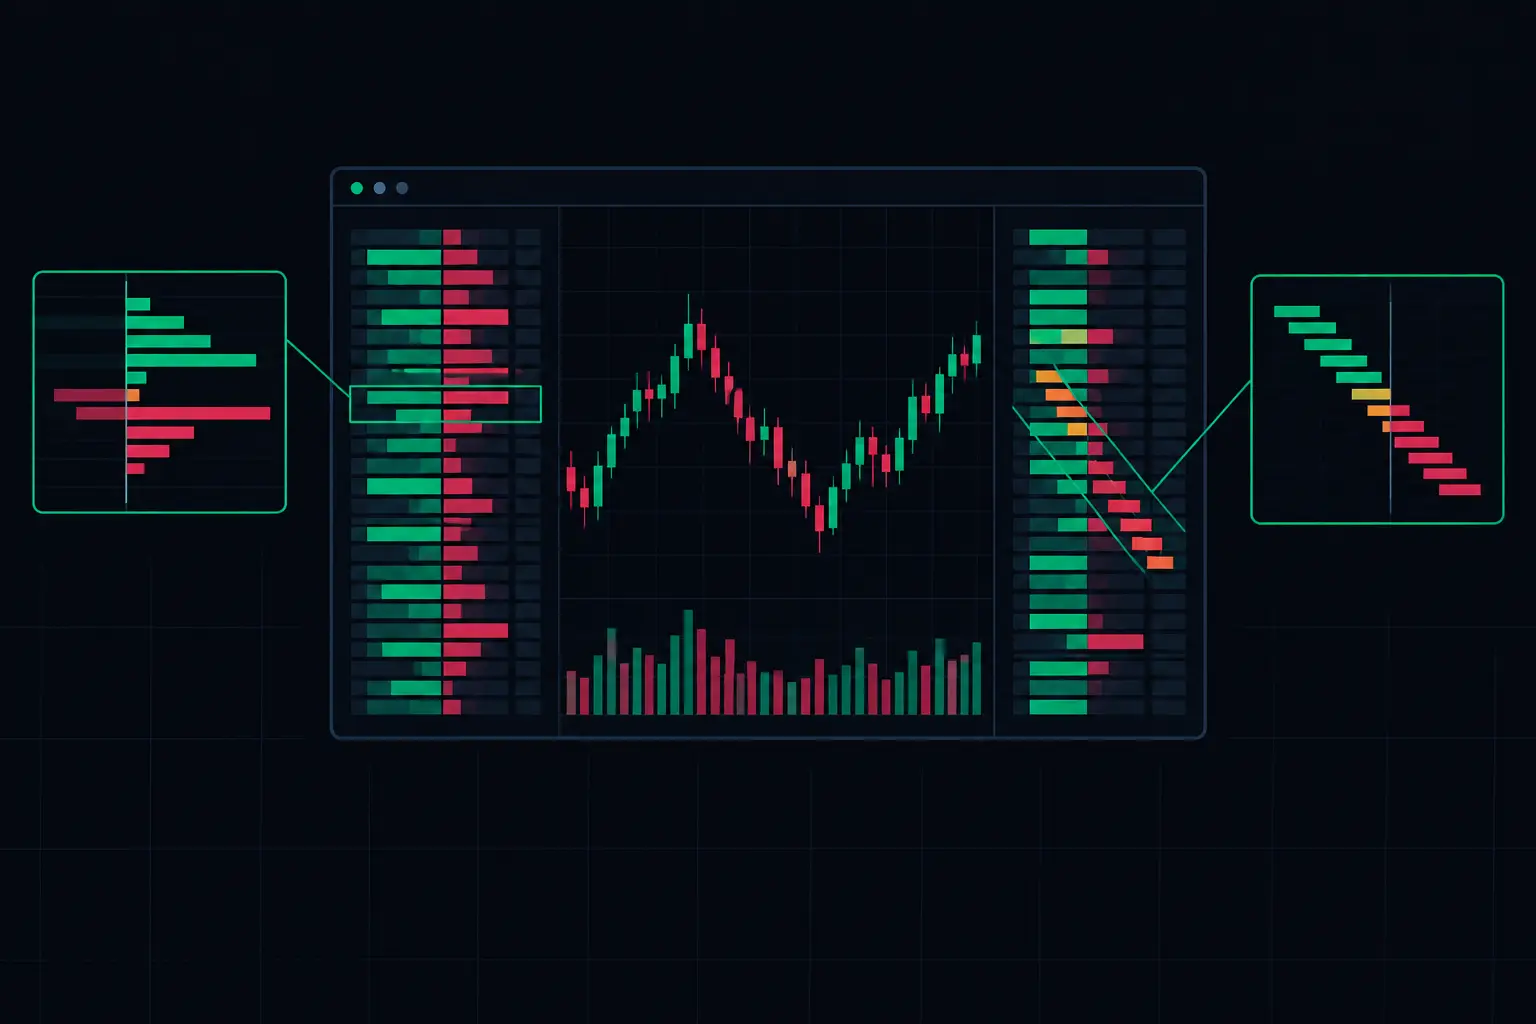
Horizontal Versus Diagonal Imbalance Detection
Horizontal versus diagonal imbalance detection clarifies bid/ask aggression at each price, giving futures traders clear footprint context in fast auction.
How to Configure Footprint Cell Filters Fast
Configure footprint cell filters to isolate meaningful bid/ask activity, control color thresholds, and keep fast order-flow charts readable at speed.