
Cumulative Delta Indicator NinjaTrader 8 Setup
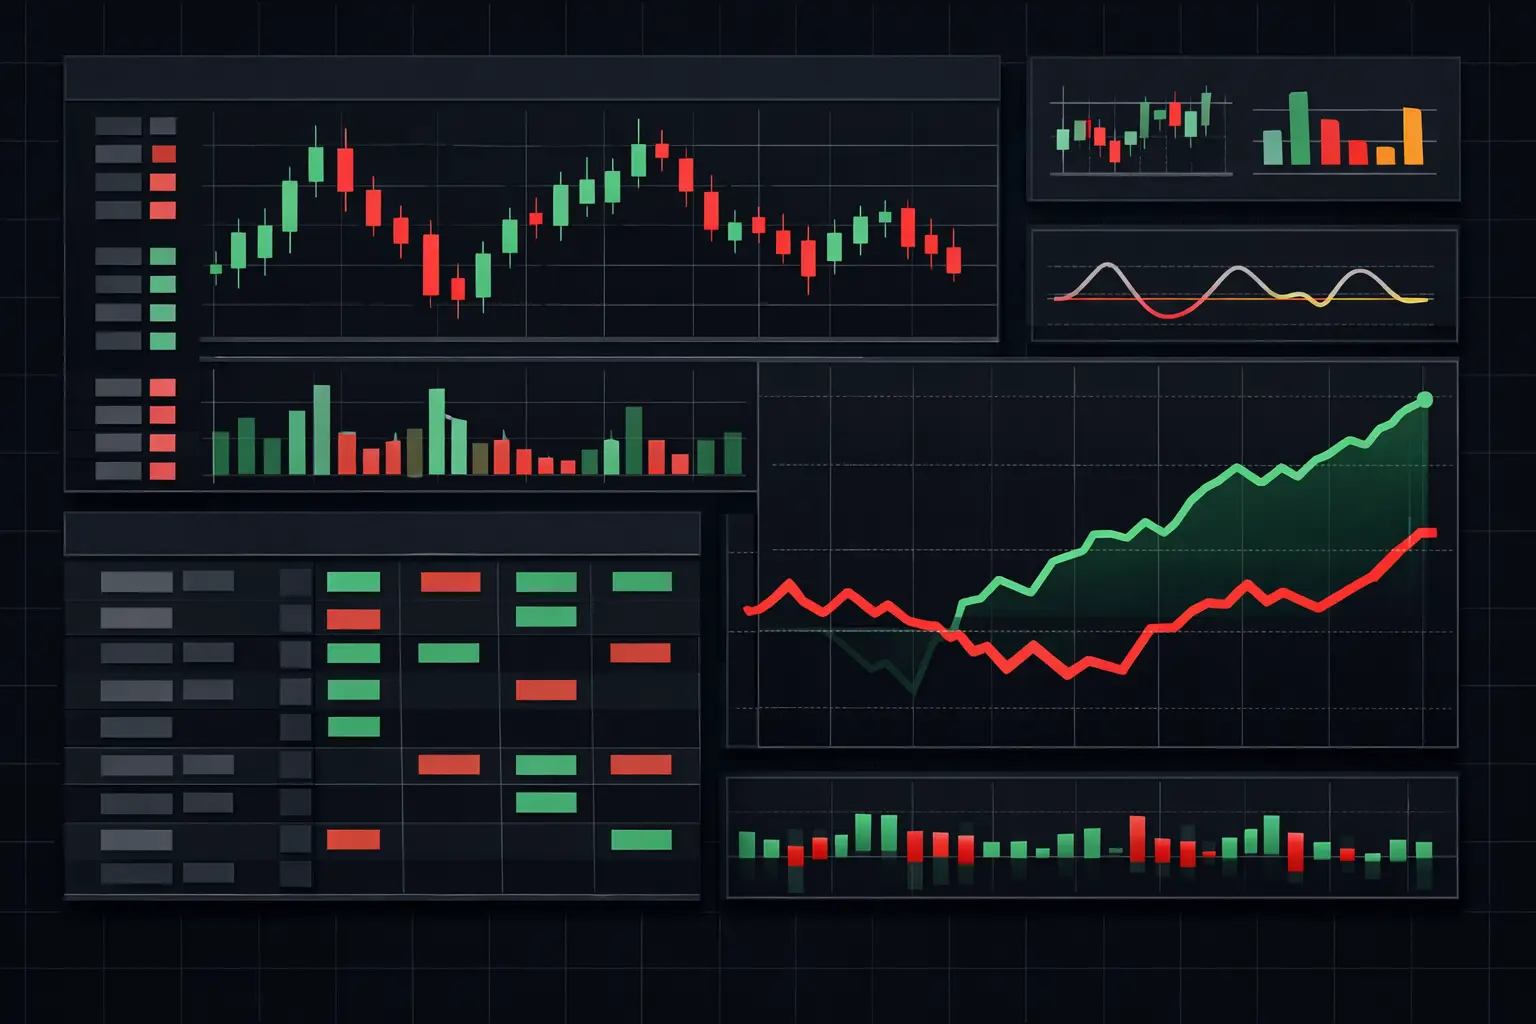
A cumulative delta indicator NinjaTrader 8 chart answers a question candles cannot: who was the aggressor at each stage of the auction? Price can push higher while ask-side aggression fades. It can hold a low while heavy market selling keeps hitting the bid. Cumulative delta makes that participation visible, bar by bar and session by session, so the chart is built on executed bid/ask volume rather than candle shape alone.
For active futures traders, the value is not a single line crossing another line. It is context. Delta shows whether aggressive participation is expanding, stalling, or being absorbed at a location that already matters: a session extreme, prior VPOC, value-area boundary, opening range, or a developing high-volume node.
What cumulative delta measures
Delta is the difference between volume executed at the ask and volume executed at the bid. When more contracts trade at the ask than at the bid, delta is positive. When more contracts trade at the bid, delta is negative. Cumulative delta adds those values over a selected reset period.
If the E-mini S&P 500 advances through several bars and each bar carries positive delta, aggressive buyers are lifting offers throughout the move. That is straightforward. The more useful cases are the exceptions. Price may continue higher while cumulative delta flattens, or it may test a low while delta drives sharply negative but price stops extending. Those are not conclusions by themselves. They are evidence that the auction is changing character.
The calculation depends on bid/ask classification. NinjaTrader 8 must receive data that can distinguish executions occurring at the bid from those occurring at the ask. A chart based only on aggregated bar volume cannot recreate that precision after the fact. The quality, granularity, and historical availability of your data directly affect what the indicator can display.
Choose the reset that matches the auction
A cumulative delta line without a reset rule is incomplete. The reset determines the story being measured.
A session reset is the standard choice for intraday index futures. It shows how aggressive volume has accumulated since the session began and makes the relationship between overnight activity, the cash open, and late-session rotation easier to read. A reset at the regular trading hours boundary can be useful when the focus is specifically on the main US auction rather than the full electronic session.
Bar-reset delta has a different job. It isolates the imbalance within each bar and removes the accumulated history. That can help when comparing participation from one rotation to the next, but it does not show whether aggressive volume has been building all day.
Custom-period resets are useful for structured workflows: an opening drive, a news window, or a defined balance area. The correct setting depends on the question. A five-minute scalper reading pace may prioritize short resets and developing bars. A trader organizing the session around value migration may want a session cumulative view beside the footprint.
Configure cumulative delta in NinjaTrader 8
Start by applying the indicator to the instrument and interval used for execution analysis. For fast ES action, many traders keep cumulative delta on a smaller chart or in a dedicated panel below a footprint chart. The panel should be visible enough to compare swing structure in price against swing structure in delta without compressing either view.
Set the calculation to bid/ask delta when the data feed supports it. This measures aggressor-side execution more directly than an up/down-tick approximation. If the available historical data does not include the required bid/ask detail, expect historical behavior to differ from real-time behavior. That distinction is operational, not cosmetic.
Next, set the trading-hours template deliberately. A full-session template and a regular-hours template produce different cumulative paths because they start and stop their calculations at different times. When a chart includes overnight inventory but delta resets at the cash open, the display is mixing two separate references unless that is intentional.
Use a consistent bar type while evaluating the indicator. Time bars, range bars, volume bars, and tick bars organize activity differently. A 5-minute chart may show a smooth delta progression during a fast auction, while a 1,000-tick chart exposes short bursts of aggressive execution. Neither is universally better. The bar type should fit the pace you need to inspect.
Finally, confirm how the indicator behaves on developing bars. Intrabar delta can expand and contract rapidly as transactions print. A reading taken before bar close is a live measure of current participation, not a fixed historical value. This matters most around thin liquidity, fast repricing, and major volume transitions.
Read delta against structure, not in isolation
The strongest use of cumulative delta is relational. Compare it with price location, volume distribution, and the footprint at the prices where the auction is being tested.
Price makes a new extreme, delta does not
When price reaches a new high but cumulative delta fails to confirm the previous positive extreme, aggressive buying has not expanded with price. The same logic applies at new lows with negative delta. This divergence can appear during a mature directional auction, but its meaning depends on what occurs at the extreme.
If the footprint shows stacked ask imbalances continuing to print and the VPOC is migrating higher, a delta divergence may simply reflect less aggressive participation than earlier, not immediate rejection. If new highs print into a passive offer area and positive delta is absorbed with little upward progress, the context is materially different.
Delta expands while price does not
This is where order-flow analysis becomes more precise than a line study. Strong positive delta at a level with limited price progress suggests aggressive buyers are meeting resting liquidity. Strong negative delta at a low with limited downside progress suggests aggressive sellers are meeting bids.
Absorption is not defined by delta alone. You need to see the price response. A large delta print that produces no extension has a different character from the same print that drives a clean multi-level auction. Footprint data lets you inspect the actual volume concentration, repeated transactions, and imbalance sequence at those prices.
Delta and value move together
A directional session often becomes clearer when cumulative delta, VPOC migration, and price acceptance align. Positive cumulative delta with a developing VPOC moving higher shows a different auction than positive delta that repeatedly fails to establish volume above an earlier value area.
That distinction prevents a common error: treating positive delta as inherently bullish or negative delta as inherently bearish. Delta measures aggression. It does not reveal whether passive participants are absorbing that aggression until price and volume structure are examined alongside it.
Pair the indicator with a footprint chart
A cumulative delta panel provides the broad pressure map. A footprint chart explains where that pressure transacted. Used together, they answer two separate questions: how has aggressor-side volume accumulated, and at which prices did it matter?
For example, cumulative delta may turn sharply negative into a prior session low. The footprint can then show whether bid volume is concentrated across multiple price levels, whether diagonal bid imbalances are stacking lower, and whether the lowest prices are producing exhaustion. If price stops extending while heavy negative delta continues, the chart identifies a potential absorption zone rather than merely a low on a candle chart.
SidiFootprint can place bid/ask volume, delta, imbalances, VPOC, value areas, and profile information directly around that cumulative context. Its dual independent profile columns are especially useful when one profile is tracking the session distribution and another is isolating a selected rotation or range. The point is not to add more color to the chart. It is to keep the cumulative view connected to the exact prices where participation changed.
Avoid the common configuration failures
Most delta confusion comes from inconsistent context. Four issues repeatedly distort the read:
- A trading-hours template resets delta at a boundary the chart user did not intend.
- Historical data lacks the bid/ask detail needed for the selected calculation.
- A chart interval hides the pace of the auction or creates bars too small to compare structure.
- The cumulative line is read without footprint, profile, or price-location context.
There is also a visual issue. Over-smoothed panels and compressed scales can make substantial intraday shifts look minor. Use a scale that preserves meaningful swings, and keep enough price history visible to compare current delta behavior with the prior auction leg.
Cumulative delta is most useful when it remains accountable to what actually traded. Keep the reset logic clean, verify the data basis, and read every expansion or divergence at the price levels where the market either accepted volume or refused it.
See it on your own chart.
Every Sidi tool is unlocked in the free 14-day demo. Install SidiFootprint in NinjaTrader 8 and load one of the finished color styles to start.
Start free 14-day demo → SidiFootprint features Browse color stylesRelated articles
NinjaTrader Indicators for Order Flow Control
NinjaTrader indicators turn bid/ask activity into real-time chart context. Configure footprint, profile, delta, and alerts for active futures markets.

NinjaTrader 8 Order Flow Configuration Setup
Configure NinjaTrader 8 order flow configuration for precise footprint charts, profiles, imbalances, delta, and fast real-time market context on tape.
Footprint Chart Software for Faster Order Flow
Footprint chart software for NinjaTrader 8 shows bid/ask activity, delta, imbalances, profiles, and absorption at every traded price level in real time.