
How to Configure Footprint Cell Filters Fast
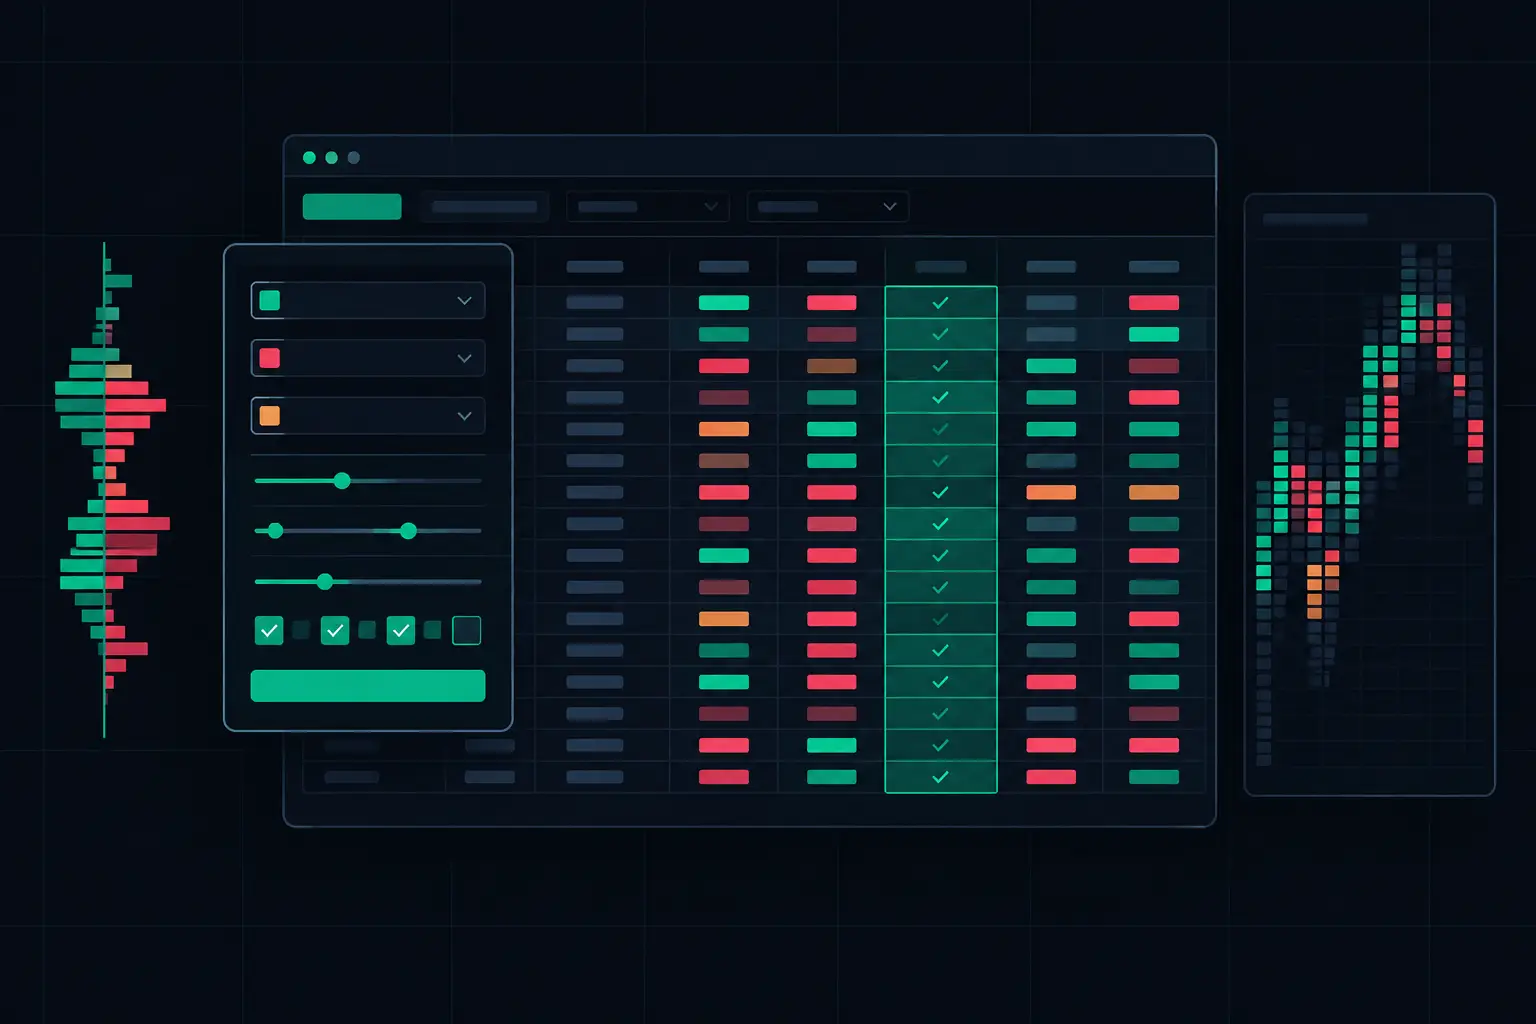
The E-mini S&P 500 can print dense bid/ask activity across dozens of price levels in a single developing bar. Without a disciplined display hierarchy, the footprint becomes a wall of numbers: technically complete, operationally slow. When you configure footprint cell filters correctly, the chart retains the activity that defines the auction while suppressing the small prints that compete for attention.
A cell filter is not a substitute for reading the tape. It is a way to impose a visual threshold on the tape so that size, delta, imbalance, and participation can be read at chart speed. The objective is not to make every bar look clean. The objective is to make exceptional activity impossible to miss without removing the context that explains it.
Configure Footprint Cell Filters Around One Primary Read
Start with the question the footprint must answer on that chart. A bid x ask footprint is built for aggressive participation at each price. Delta emphasizes the difference between aggressive buyers and sellers. Total volume emphasizes acceptance and rotation. Trade count can expose whether a price level was built through many smaller executions or a smaller number of larger ones.
Trying to filter every calculation with the same threshold usually creates a distorted chart. A volume threshold that works well for total volume does not automatically translate to delta, and an imbalance condition is not simply a large-volume condition. Each calculation describes a different part of the auction.
For a primary execution-style chart, keep one calculation visually dominant and use the others as confirmation layers. For example, bid x ask numbers may remain visible at a practical minimum, while delta cells receive stronger color only beyond a separate threshold. This preserves the relationship between actual traded volume and directional aggression.
Separate Visibility From Emphasis
The first decision is whether a filter should hide information or simply reduce its visual weight. Those are different operations.
A visibility filter removes low-priority cells from the active reading surface. It is useful when small prints are so frequent that they obscure larger participation. An emphasis filter leaves the numbers available but reserves stronger text, background color, or markers for cells that exceed a threshold.
In most active futures layouts, a combination is more useful than an aggressive hide-only setup. Keep a modest base level of cell data visible, then use color progression to distinguish meaningful participation. A completely sparse footprint may look efficient, but it can erase the ladder structure around a VPOC test, a failed auction, or absorption at a prior extreme.
Build the Threshold Stack From Raw Activity Up
Cell filtering works best when thresholds are layered rather than treated as one universal cutoff. Begin with an absolute minimum for the instrument and bar construction you use. On a fast ES chart, the minimum that removes incidental prints during a quiet rotation may be far too low during the cash open. On a slower bar type, that same setting may remove too much context.
The practical sequence is straightforward: first set the minimum value required for a cell to remain readable. Next, define the value at which the cell receives emphasis. Then add specialized conditions, such as delta extremes or imbalances, on top of that base display.
This gives the chart a clear hierarchy. Ordinary activity is present but quiet. Larger activity stands out. Exceptional activity has its own visual treatment.
Use Absolute and Relative Context Deliberately
Absolute thresholds are stable. A 200-contract cell means the same thing mathematically in every bar. That consistency is useful for recognizing familiar participation levels at repeated prices.
Relative thresholds adapt to the bar or session environment. A cell that represents a meaningful percentage of a bar's total volume can remain relevant even when overall activity expands or contracts. The trade-off is that relative filtering can make the same raw size appear important in one bar and ordinary in another.
Neither method is universally better. Absolute filters are often cleaner for a specific instrument and time window. Relative filters are useful when the chart spans materially different participation regimes. If the footprint is used alongside session profile data, retain enough unfiltered structure to see whether a highlighted cell occurred at value, at the developing VPOC, or at an auction extreme.
Color Must Encode a Priority, Not Decorate the Grid
Color thresholds are where a footprint either becomes fast to read or becomes visually noisy. Assign each color to one clear condition. If bright green can mean high ask volume, positive delta, a diagonal imbalance, or a profile condition, it no longer communicates a specific fact at a glance.
A practical hierarchy uses restrained formatting for normal cells, a stronger level for elevated activity, and a distinct treatment for the highest tier. Bid-side and ask-side conditions should remain visually separate. The chart should not require reading a legend to identify whether the highlighted number reflects aggressive selling, aggressive buying, or balanced total volume.
Avoid using saturated backgrounds for every threshold. Heavy fills across multiple adjacent price levels can bury the numbers themselves, especially during developing bars. Text color, selective background color, and a limited number of high-contrast conditions usually produce a more legible ladder.
SidiFootprint supports deep control over cell colors, text, backgrounds, and condition-driven formatting, so the key is restraint. Use that control to reduce interpretation time, not to display every available calculation at maximum intensity.
Configure Imbalance Filters Independently
An imbalance is a comparison, not merely a large number. In a diagonal imbalance, ask volume at one price is compared with bid volume one tick below, while bid volume is compared with ask volume one tick above. That relationship is what reveals aggressive initiative across the ladder.
For that reason, imbalance filtering needs its own minimum-volume and ratio logic. A high ratio produced from very small numbers can be mathematically valid but visually unimportant. Requiring a minimum absolute volume alongside the imbalance ratio prevents thin activity from receiving the same treatment as substantial participation.
Stacked imbalances deserve another layer of control. A sequence of qualifying prices carries different structural information than one isolated cell. Keep the visual treatment for a stack distinct from the treatment for a single imbalance, but do not let it override all other context. A stack located into low-volume territory, at a session extreme, or near a profile edge is still best read with the surrounding footprint intact.
Keep Developing Bars From Rewriting the Story
Filters are evaluated against activity that is still changing. A developing footprint cell can cross a volume, delta, or imbalance threshold, then move back below it as new executions arrive. That is normal behavior, not a charting defect.
The configuration question is how much intrabar change you want displayed. Lower thresholds expose evolving participation earlier but create more color changes. Higher thresholds reduce flicker but may reserve emphasis for only the most developed conditions. The right balance depends on bar duration, instrument pace, and whether the chart is intended for close reading of the active auction or broader structural review.
Do not confuse a filtered developing cell with a finalized condition. Let the footprint show the current state of the bar, while session profile, cumulative delta, and completed-bar structure provide the larger frame.
Protect Profile Context When Filtering Cells
Footprint cells and profile columns answer related but different questions. The footprint shows what traded at each price within the bar. Volume profile shows where volume accumulated across the selected range. VPOC, value area, and dual independent profile columns should remain readable even when the cell grid is aggressively filtered.
This separation matters around high-volume nodes. A cell filter may reduce the visual presence of smaller prints within a bar, while the profile still shows that the broader auction accepted that area. Conversely, a bright imbalance at an edge can stand out precisely because the profile confirms that it occurred away from established value.
Treat profile settings as the structural layer and cell filters as the microscope. If both use the same colors and intensity, the chart loses depth. Give each layer a defined visual role.
Stress-Test the Filter During Fast Conditions
A configuration that looks precise in a slow rotation may fail when volume expands. Test it across opening activity, scheduled data releases, and late-session rotations. Watch for three problems: too many highlighted cells, empty-looking bars that hide useful structure, and colors that no longer distinguish one condition from another.
When the grid becomes crowded, raise the minimum display threshold before changing the imbalance ratio. When it becomes too sparse, restore baseline volume visibility before weakening high-priority color conditions. Small changes are easier to evaluate because you can identify exactly what the chart gained or lost.
The finished layout should make the next meaningful price-level comparison obvious while leaving enough auction structure on screen to explain it. If a filter forces you to guess what was removed, it is filtering too hard.
See it on your own chart.
Every Sidi tool is unlocked in the free 14-day demo. Install SidiFootprint in NinjaTrader 8 and load one of the finished color styles to start.
Start free 14-day demo → SidiFootprint features Browse color stylesRelated articles
NinjaTrader Indicators for Order Flow Control
NinjaTrader indicators turn bid/ask activity into real-time chart context. Configure footprint, profile, delta, and alerts for active futures markets.
Configure Footprint Cell Metrics for Fast Tape
Configure footprint cell metrics to expose bid/ask pressure, delta, trades, and imbalance structure without burying fast-market auction context in noise.
Footprint Chart Software for Faster Order Flow
Footprint chart software for NinjaTrader 8 shows bid/ask activity, delta, imbalances, profiles, and absorption at every traded price level in real time.