
How to Build Dual Session Profiles in NinjaTrader
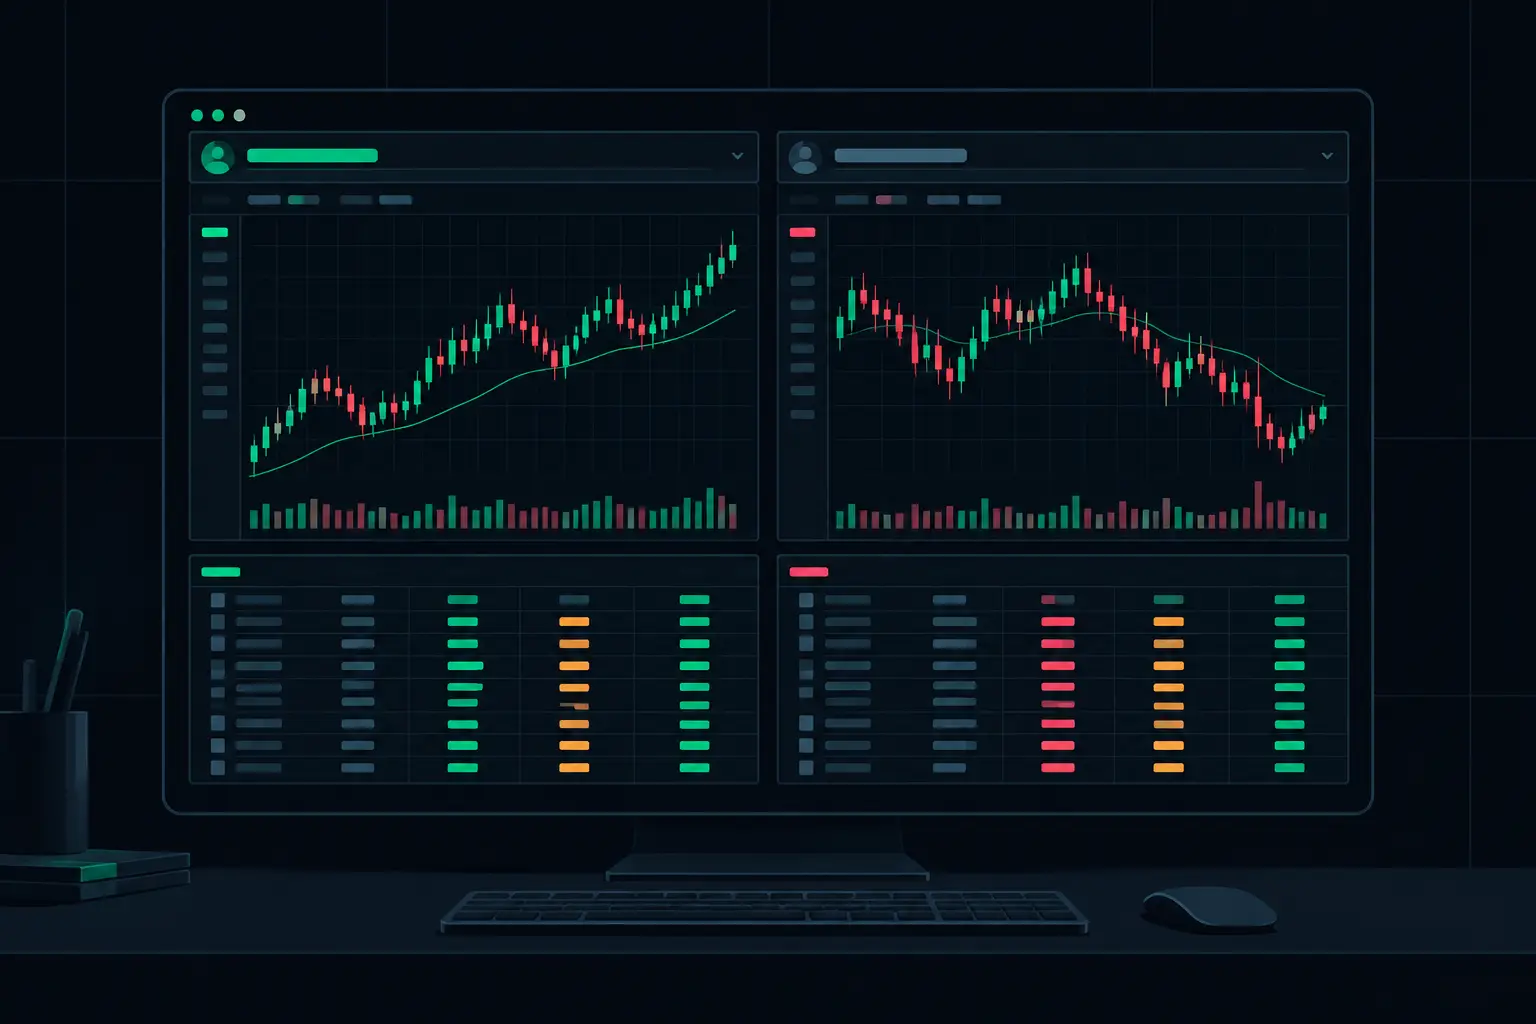
The opening rotation can look balanced on a footprint chart while the larger auction context is clearly one-sided. That disconnect is exactly why active futures traders build dual session profiles: one profile can expose the current session's developing distribution while a second preserves the reference distribution that price is interacting with. Instead of compressing every auction into one blended histogram, the chart keeps both structures visible at the price levels where they matter.
A single volume profile answers a useful but limited question: where did volume accumulate during one defined period? Dual profiles add comparison. They show whether current participation is accepting prices inside a prior value area, building volume above it, rejecting a low-volume edge, or rotating around a separate VPOC. For fast ES order flow, that second column prevents a developing session from erasing the context that produced the current test.
Why Build Dual Session Profiles Instead of One?
A session profile is a distribution, not just a visual volume histogram. Its shape records where the auction spent time and where contracts changed hands. The VPOC marks the highest-volume price within that distribution; value area defines the range containing the configured percentage of volume. High-volume nodes often mark areas of acceptance, while low-volume areas can show a faster transition between accepted prices.
When only one profile is displayed, those references shift as the session develops. That is useful for reading the live auction, but it can hide the relationship between today's activity and the overnight or prior regular trading hours structure. Dual independent columns solve that layout problem without forcing a trader to switch templates, load a second chart, or mentally reconstruct where volume previously concentrated.
The most practical use is to place a fixed reference profile beside a developing profile. For example, the left column can hold the overnight session and its completed VPOC, value-area high, and value-area low. The adjacent column can build from the regular trading hours open and update on each developing bar. The chart then shows two auctions at once: the completed distribution that established inventory and the active distribution testing it.
This is not limited to overnight versus regular trading hours. A second profile can represent the prior day, prior week, a custom event window, or another session template. The correct pairing depends on the instrument's liquidity cycle and the auction reference being studied.
Build Dual Session Profiles With Independent Rules
The key word is independent. Two profile columns should not be duplicates with different colors. Each needs its own session boundaries, calculation state, width, placement, and visual references. If both columns reset on the same schedule and calculate the same data, the extra profile adds little analytical value.
In NinjaTrader 8, begin by defining the two session windows before adjusting cosmetics. Select the trading-hours template that supplies the intended data boundaries, then determine whether each profile should reset at the start of its session or remain fixed after completion. A developing regular-hours profile and a completed overnight profile require different reset behavior by design.
For the reference profile, use a completed period. Its VPOC and value area should remain stable once that session closes. Stability is the point: the levels represent a finished volume distribution and retain their meaning while the next auction unfolds.
For the active profile, allow the distribution to develop in real time. As volume accumulates, the VPOC can migrate and the value area can expand or rotate. This lets the chart show whether the current auction is building acceptance at a new location or repeatedly returning to an earlier reference.
SidiFootprint supports dual independent profile columns within the same footprint workspace, so the volume profile remains aligned with the bid-by-ask activity at each price. The profile is not isolated from order flow. A developing VPOC can be read alongside delta, traded volume, stacked imbalances, absorption, and exhaustion at the prices forming that distribution.
Set the session boundaries first
A profile's usefulness depends on clean boundaries. Define what constitutes the first auction and what constitutes the second before choosing colors or opacity. For index futures, an overnight profile paired with regular trading hours is a common structure because it separates thinner overnight participation from the more concentrated daytime auction.
However, that pairing is not universal. A trader focused on the US cash open may use a pre-open profile and an opening-range profile. A trader analyzing a multi-day rotation may retain the prior session as the fixed column and build the current session separately. The profile logic should match the auction period, not a generic chart preset.
Be precise about session transitions. If one column includes the final minutes of the prior period while the other begins before that period fully ends, the distributions overlap. That overlap can distort the comparison, especially around a VPOC formed near the boundary. Clean session definitions produce clean references.
Separate developing and completed states
The fixed profile is a reference map. The developing profile is a live measurement. Mixing those roles creates confusion because a migrating VPOC and a static VPOC do not communicate the same information.
Keep the completed profile visually stable and compact. Its purpose is to preserve the prior auction's shape, key volume nodes, and value-area limits without competing with current price. The developing column can be wider or use a stronger fill because it is expected to change as contracts trade.
This distinction becomes especially useful when current price trades near the previous session's VPOC. The chart can show whether volume is building around that level again, migrating away from it, or passing through it with little new acceptance. The footprint cells provide the participation detail; the paired profiles show where that detail sits in the broader auction.
Place the columns where they remain readable
Dual profile layouts need enough horizontal separation to prevent value-area labels and VPOC lines from colliding. Position both columns consistently on one side of the chart or assign each to a different side when the workspace is dense. The best arrangement is the one that leaves the price ladder and footprint numbers readable during high-volume rotations.
Profile width should reflect purpose. A completed reference often needs less width because its shape will not change. A developing profile may need more room if the display includes value-area shading, VPOC extension, node highlighting, or session labels. Avoid oversized histograms that cover the very bid/ask prints needed to interpret the auction.
Color is functional, not decorative. Use visibly different colors for the two distributions and reserve the strongest contrast for VPOCs, value-area boundaries, and low-volume areas. If the profile colors are too similar, the eye loses the separation between prior acceptance and current acceptance precisely when price revisits a key level.
Reading the Relationship Between Two Profiles
The value of dual profiles appears in the relationship, not in either histogram alone. A current profile developing entirely within a prior value area shows a different auction condition than one building volume above the prior value-area high. The chart is not forecasting an outcome. It is organizing the location and intensity of actual participation.
Watch the current VPOC relative to the fixed VPOC. When the developing VPOC remains near the prior VPOC, both sessions may be concentrating volume around the same price. When it relocates while the fixed profile remains below or above, the chart shows where the active auction is establishing a different center of trade.
Value-area overlap also matters. Broad overlap can show repeated interaction with an established distribution. A developing value area that forms outside the completed value area separates current acceptance from the earlier range. Low-volume areas between the two profiles can clarify whether price is transitioning through a thin zone or building new volume inside it.
The footprint adds the necessary microstructure. At a profile edge, diagonal imbalances show aggressive ask volume at one price compared with bid volume one tick below, or aggressive bid volume compared with ask volume one tick above. Absorption can reveal passive liquidity holding against aggressive market orders. Cumulative delta can show whether directional aggression is expanding or fading while volume accumulates at a profile node.
A profile without footprint context can show where activity occurred but not how it occurred. Footprint data without profile context can show aggressive prints without establishing whether they are forming at value, at a low-volume edge, or at a session VPOC. Dual profiles make the location explicit while order flow describes the participation at that location.
Configuration Errors That Weaken the Layout
The most common error is comparing unequal periods without realizing it. A full overnight profile beside a partial regular-hours profile is valid if the difference is intentional. It is less useful when the active column was expected to represent the full day but reset because of an incorrect trading-hours template.
Another error is allowing visual elements to stack on top of each other. If both VPOC extensions, value-area lines, session labels, and profile fills share similar colors, the result is density without clarity. Reduce nonessential labels, separate the columns, and make the hierarchy obvious: fixed reference, active distribution, then footprint detail.
Finally, do not treat every volume bulge as equivalent. A high-volume node formed during the overnight session may carry a different participation profile than a high-volume node built during regular trading hours. The dual layout preserves that distinction instead of merging both into a single distribution that conceals timing.
A well-built dual-profile chart does not add noise. It separates two auctions, fixes the references that should remain fixed, and lets the developing session reveal where volume is actually organizing as the tape accelerates.
See it on your own chart.
Every Sidi tool is unlocked in the free 14-day demo. Install SidiFootprint in NinjaTrader 8 and load one of the finished color styles to start.
Start free 14-day demo → SidiFootprint features Browse color stylesRelated articles
Volume Profile Indicator for Faster Context
Use a volume profile indicator to map VPOC, value area, and high-volume acceptance across each futures session with precise auction context during RTH.
VPOC Versus Session POC and What Each Shows
VPOC versus session POC is a scope question. Learn how profile boundaries, developing volume, migration, and acceptance sharpen futures chart daily context.
Volume Profile Software for Fast Futures Charts
Volume profile software maps traded volume by price, giving active futures traders developing VPOC, value areas, and session context in real time daily.