
Session Volume Profile NinjaTrader Setup
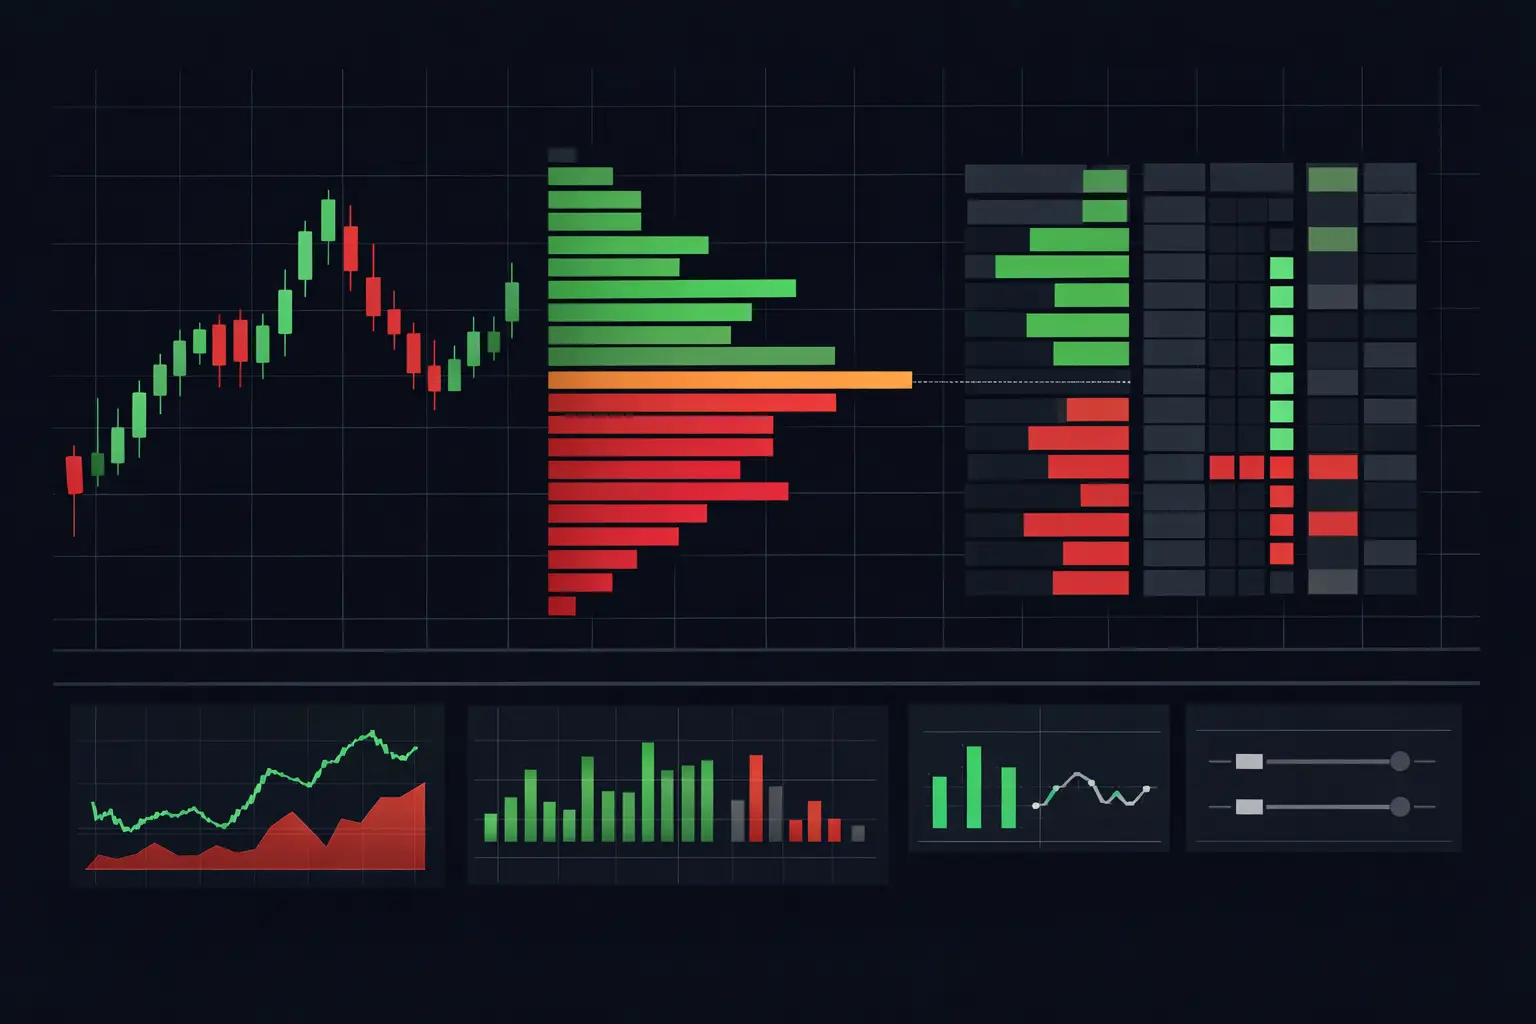
A session volume profile in NinjaTrader is not a decorative histogram at the edge of the chart. It is a distribution of executed volume that exposes where the auction spent time doing business, where it moved quickly, and where participation concentrated. On a fast ES session, that context changes how a footprint bar is read: aggressive volume at a price matters differently when it occurs at the session VPOC than when it occurs through a thin-volume area.
Most traders stare at candles and guess whether a move has acceptance behind it. A properly configured session profile shows the auction structure directly - volume by price, session VPOC, value area, and the developing shape of participation as the session unfolds.
What a Session Volume Profile Measures
A session profile aggregates every executed contract within a defined trading session and organizes that volume by price. The widest row is the VPOC, or volume point of control: the price with the greatest executed volume for that session. The value area then encloses the selected percentage of total volume, commonly 70%, around the VPOC.
This is different from a bar-based volume display. A five-minute bar can show high total volume without showing whether that volume was concentrated at one price, distributed across a range, or created during a rapid auction through several levels. The profile answers that structural question.
The session boundary is not a cosmetic setting. If the profile begins at the electronic session open, it includes overnight participation and the regular trading-hours auction in one distribution. If it begins with the regular trading-hours template, it isolates the daytime auction. Neither view is inherently superior. They describe different participation windows and should be selected to match the context being examined.
Configure Session Volume Profile in NinjaTrader
The useful configuration work happens before the session starts. A profile that uses the wrong session template, too much row aggregation, or an unreadable color hierarchy can conceal the very detail it is supposed to expose.
Define the session template first
In NinjaTrader 8, the trading-hours template determines when a session starts, ends, and resets. For index futures, an electronic-session template captures the continuous futures auction, while a regular-hours template isolates the primary US cash-hours window. Confirm that the template matches the intended instrument and exchange schedule before evaluating the profile.
A separate profile for overnight and regular hours is often cleaner than forcing both auctions into one column. Overnight volume can create its own VPOC and value area. Keeping it distinct makes the handoff into regular hours visible without compressing two different distributions into a single shape.
Use price rows that preserve auction detail
Profile resolution determines how many ticks are combined into each horizontal row. One-tick rows provide the maximum price-level detail, which is valuable when the profile is paired with bid/ask footprint data. Larger row sizes reduce visual density but can merge meaningful structure, especially in narrow rotations or near concentrated volume.
There is a practical trade-off. On a compact chart or a broad session range, one-tick rows can become dense. In that case, increase the profile width or allocate a dedicated profile column before increasing row aggregation. Preserving the actual tick structure is usually more informative than simplifying it away.
Keep developing references visible
A completed profile describes where volume accumulated. A developing profile shows where that distribution is forming now. Display the developing VPOC and developing value-area boundaries when the chart layout has enough room. Their movement reveals whether current participation is building around a new price area or continuing to reinforce an existing one.
Do not treat a developing VPOC as fixed structure. It can migrate as more volume prints. The value of the reference is precisely that it updates with the auction rather than remaining static.
Read the Distribution With Footprint Data
A volume profile shows where volume occurred. A footprint chart shows how that volume occurred at each price - bid volume, ask volume, delta, trade count, diagonal imbalances, absorption, and exhaustion. Together, they prevent a common analytical error: assigning the same meaning to every high-volume area.
A high-volume node may represent balanced two-way activity, repeated aggressive lifting at the ask, repeated hitting at the bid, or passive liquidity absorbing aggressive orders. The profile identifies the node. The footprint supplies the participation details.
VPOC is a concentration point, not a complete explanation
The session VPOC identifies maximum executed volume, but it does not label the character of that volume. Examine the footprint cells around it. Alternating bid and ask activity with contained delta often accompanies two-way rotation. Large persistent delta at the same price with limited extension can reveal absorption by resting liquidity.
That distinction matters because the same VPOC can be created by very different auction conditions. Volume concentration alone is context. Bid/ask interaction supplies the mechanism.
Thin areas show fast auction travel
Low-volume areas are prices where the session spent comparatively little volume. They often appear as narrow portions of the profile between broader volume nodes. On the chart, inspect the bars that formed through those prices. Stacked imbalances, expanding delta, and limited opposing volume describe a different event than scattered volume across a wide range.
A thin area should not be treated as a line with a fixed outcome attached to it. It is a record of limited historical participation during that particular session. The developing footprint shows whether later activity is passing through, pausing, or building new volume there.
Watch profile shape and delta separately
A profile can be balanced in shape while cumulative delta trends strongly in one direction. It can also extend into a new area while delta stalls or reverses. These are not contradictions. Volume profile measures distribution; delta measures the difference between volume executed at the ask and volume executed at the bid.
Keeping both visible prevents shape from being mistaken for directional pressure, or delta from being viewed without its location in the session structure. A large delta event at the edge of value has different context than the same event in the center of a broad high-volume node.
Build a Chart Layout That Holds Context
The chart should keep session structure visible without obscuring the price ladder. A practical layout places the current session profile beside the footprint, with prior-session or overnight profiles in a separate column. This preserves a clean distinction between active and completed auctions.
SidiFootprint supports dual independent profile columns, which is useful for showing a developing regular-hours profile beside a completed overnight or prior-session profile. Each column can retain its own display logic rather than forcing unrelated distributions into one overlay.
Use deliberate visual hierarchy. The VPOC should be immediately recognizable. Value-area boundaries should be visible but lighter than the VPOC. Low-volume regions need enough contrast to remain readable against footprint numbers, while profile fill should not compete with imbalance markers, delta shading, or text.
When the tape accelerates, readability is a performance feature. If profile opacity hides bid/ask cells or footprint text disappears behind multiple session references, reduce visual clutter rather than removing the structural data.
A Practical ES Session Workflow
For an E-mini S&P 500 futures chart, define the intended trading-hours template and display the session profile from that boundary. Keep the prior completed session available for reference, then let the current profile develop independently. As volume accumulates, monitor three things together: VPOC migration, value-area expansion or containment, and the footprint behavior at the prices creating that volume.
If the developing profile builds repeatedly at a narrow set of prices, inspect whether the footprint shows balanced exchange or absorption. If volume extends into a previously thin area, inspect whether the move is accompanied by consecutive diagonal imbalances and expanding traded volume, or whether participation quickly begins to build a new node. The chart is not providing a directive. It is showing the auction process in enough detail to avoid reading a profile shape in isolation.
For shorter intraday windows, a session profile can remain the primary structural frame while smaller composite or rolling profiles provide local detail. Avoid placing every profile type on the same chart by default. Each added distribution should answer a distinct question, not duplicate the same volume map with a different color.
Configuration Errors That Distort the Profile
Four errors routinely weaken session-profile analysis:
- Using a trading-hours template that combines participation windows you intended to compare separately.
- Aggregating too many ticks per row and merging distinct price-level volume into a broad block.
- Displaying only completed session references and losing the developing distribution during active conditions.
- Overlaying so many prior profiles, value areas, and labels that the footprint ladder becomes unreadable.
The correction is not more indicators. It is a cleaner relationship between session definition, row resolution, profile placement, and the order-flow data beside it.
A session volume profile earns chart space when it remains connected to what actually traded at each price. Set the session boundary with intent, preserve enough tick-level detail to see the distribution, and keep the developing profile beside the footprint. That combination turns a static volume histogram into an execution-grade map of the live auction.
See it on your own chart.
Every Sidi tool is unlocked in the free 14-day demo. Install SidiFootprint in NinjaTrader 8 and load one of the finished color styles to start.
Start free 14-day demo → SidiFootprint features Browse color stylesRelated articles
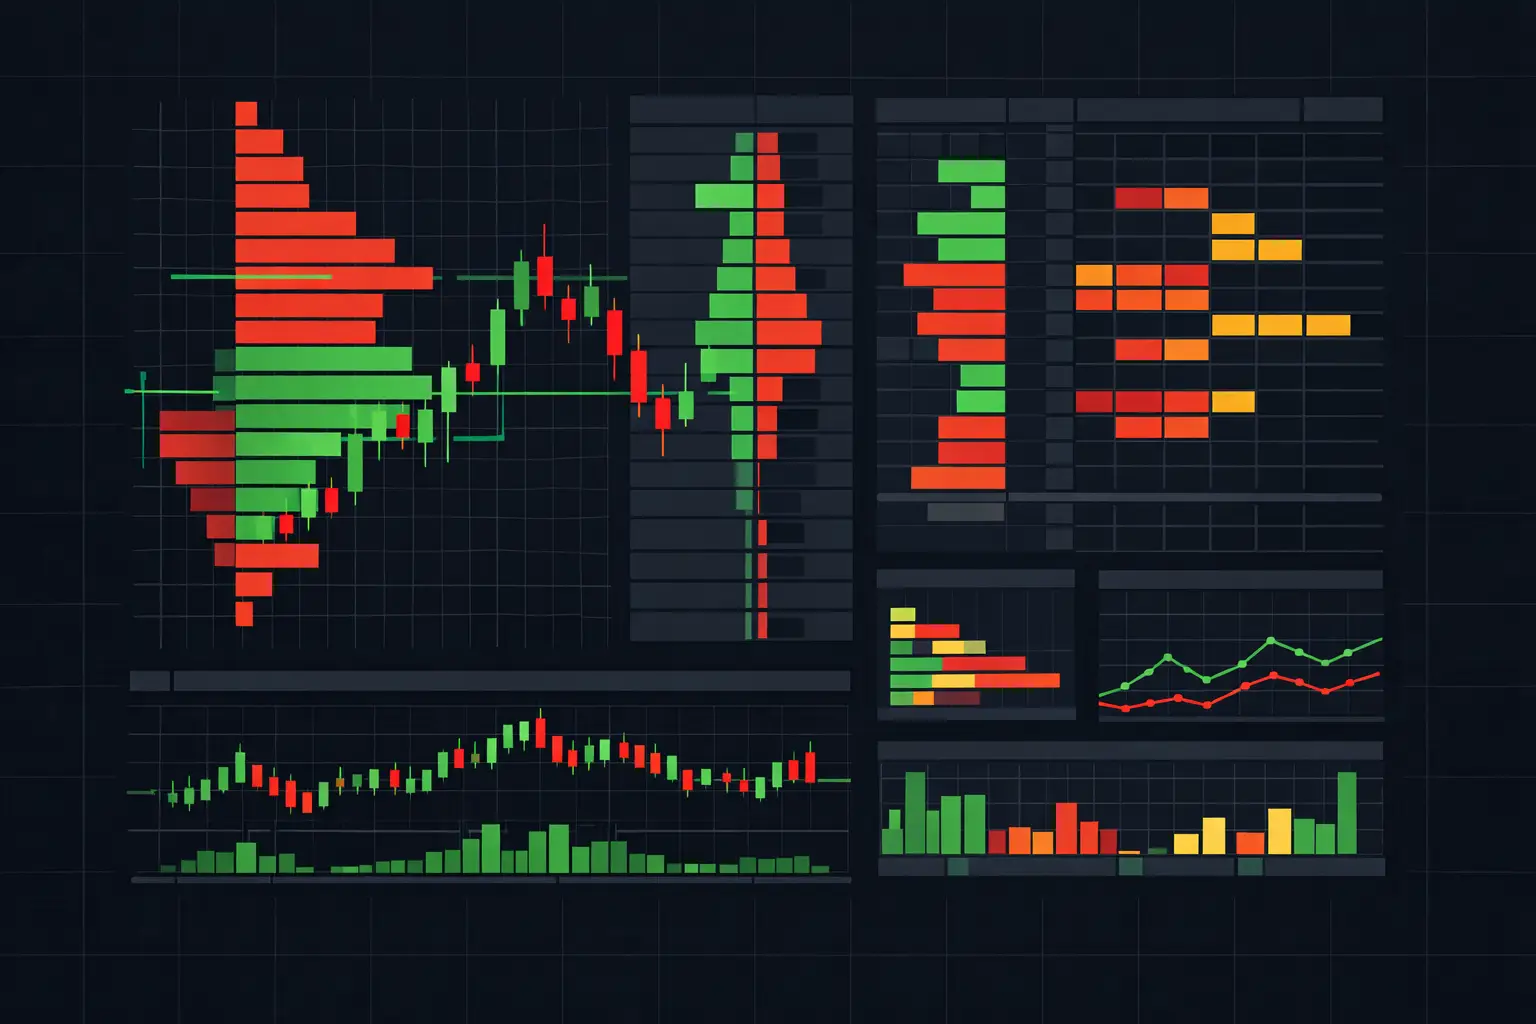
Volume Profile Software for Fast Futures Charts
Volume profile software maps traded volume by price, giving active futures traders developing VPOC, value areas, and session context in real time daily.
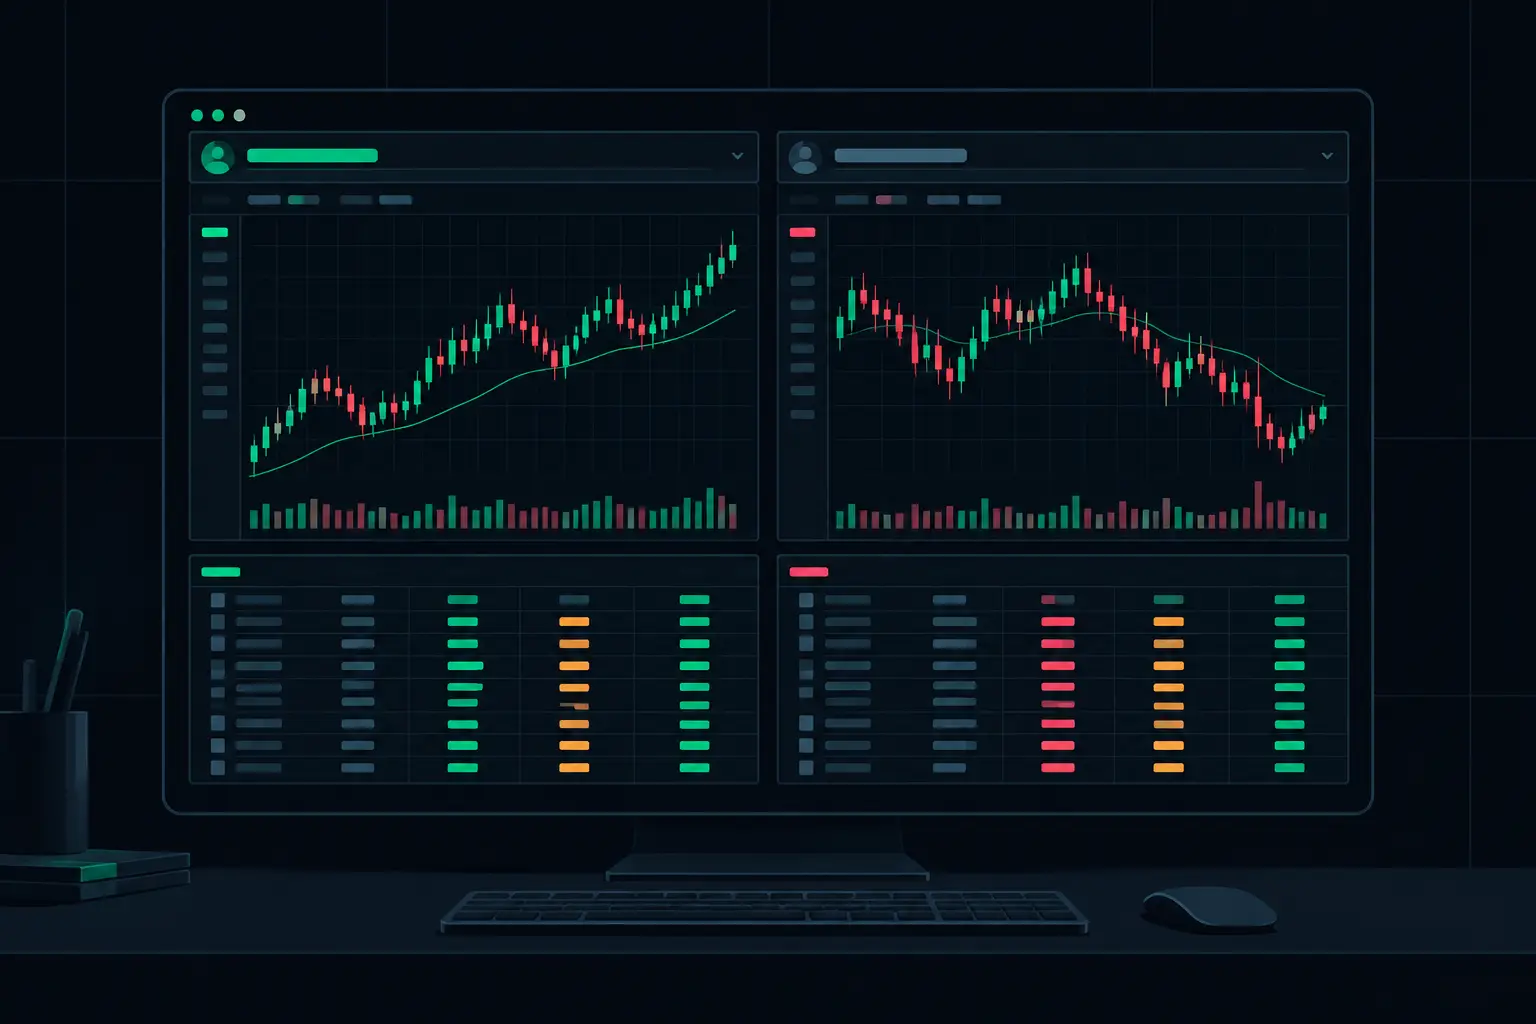
How to Build Dual Session Profiles in NinjaTrader
Learn how to build dual session profiles in NinjaTrader 8, separating auction context, VPOC, value area, and developing volume at a glance on one chart.
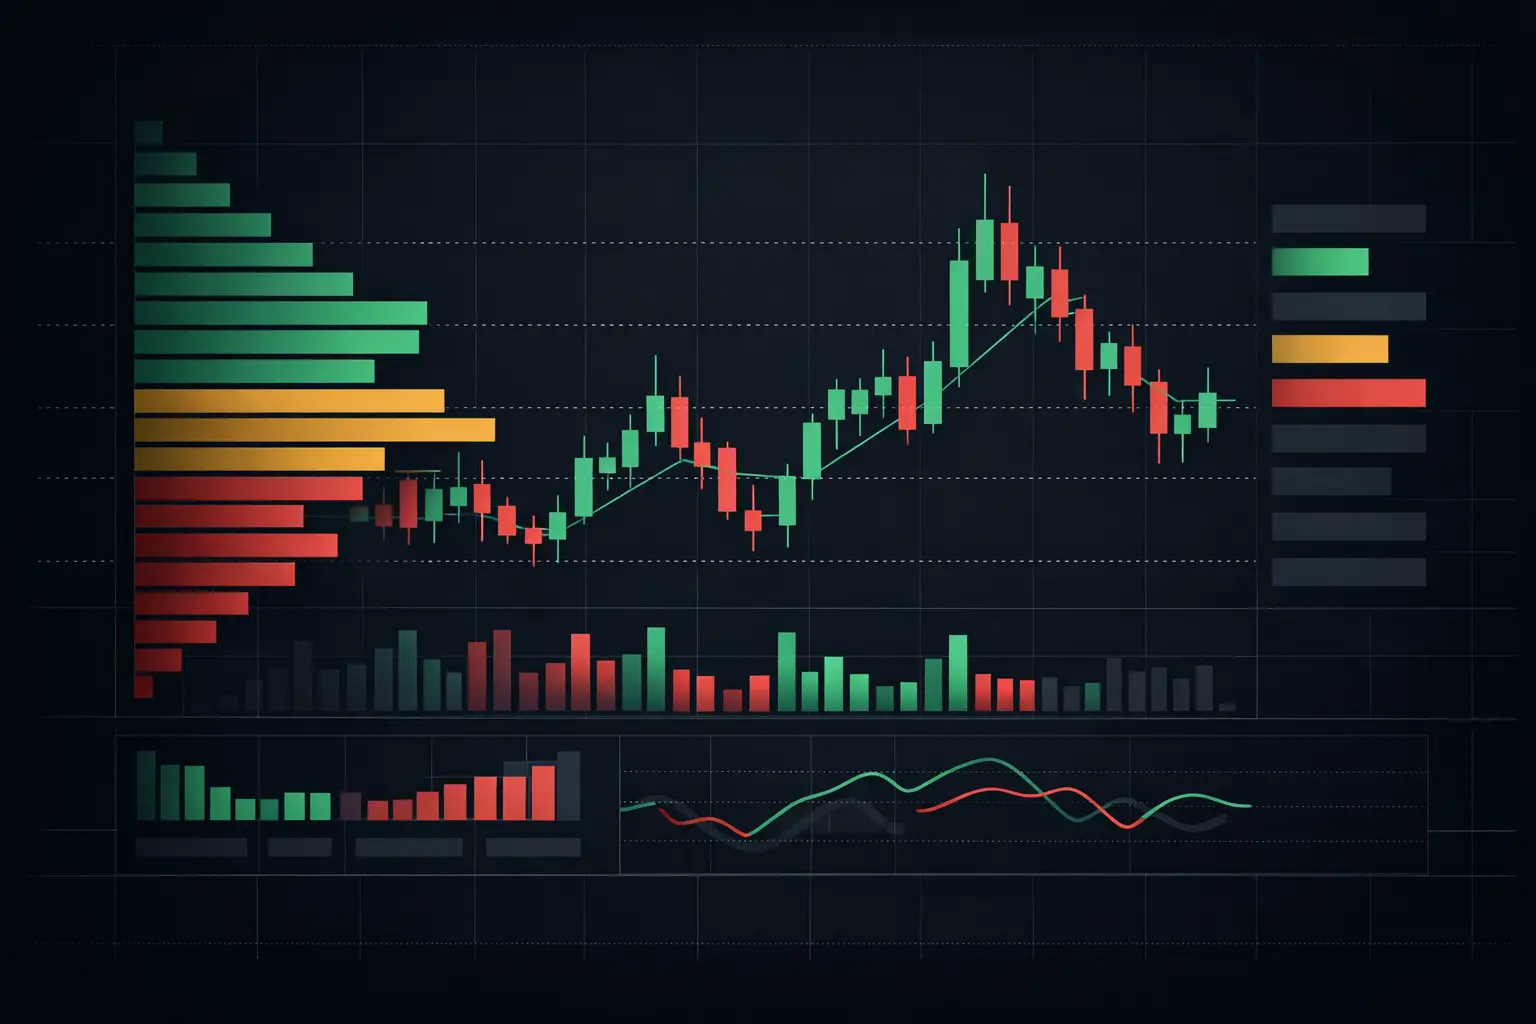
Volume Profile Indicator for Faster Context
Use a volume profile indicator to map VPOC, value area, and high-volume acceptance across each futures session with precise auction context during RTH.