
Volume Profile Indicator for Faster Context
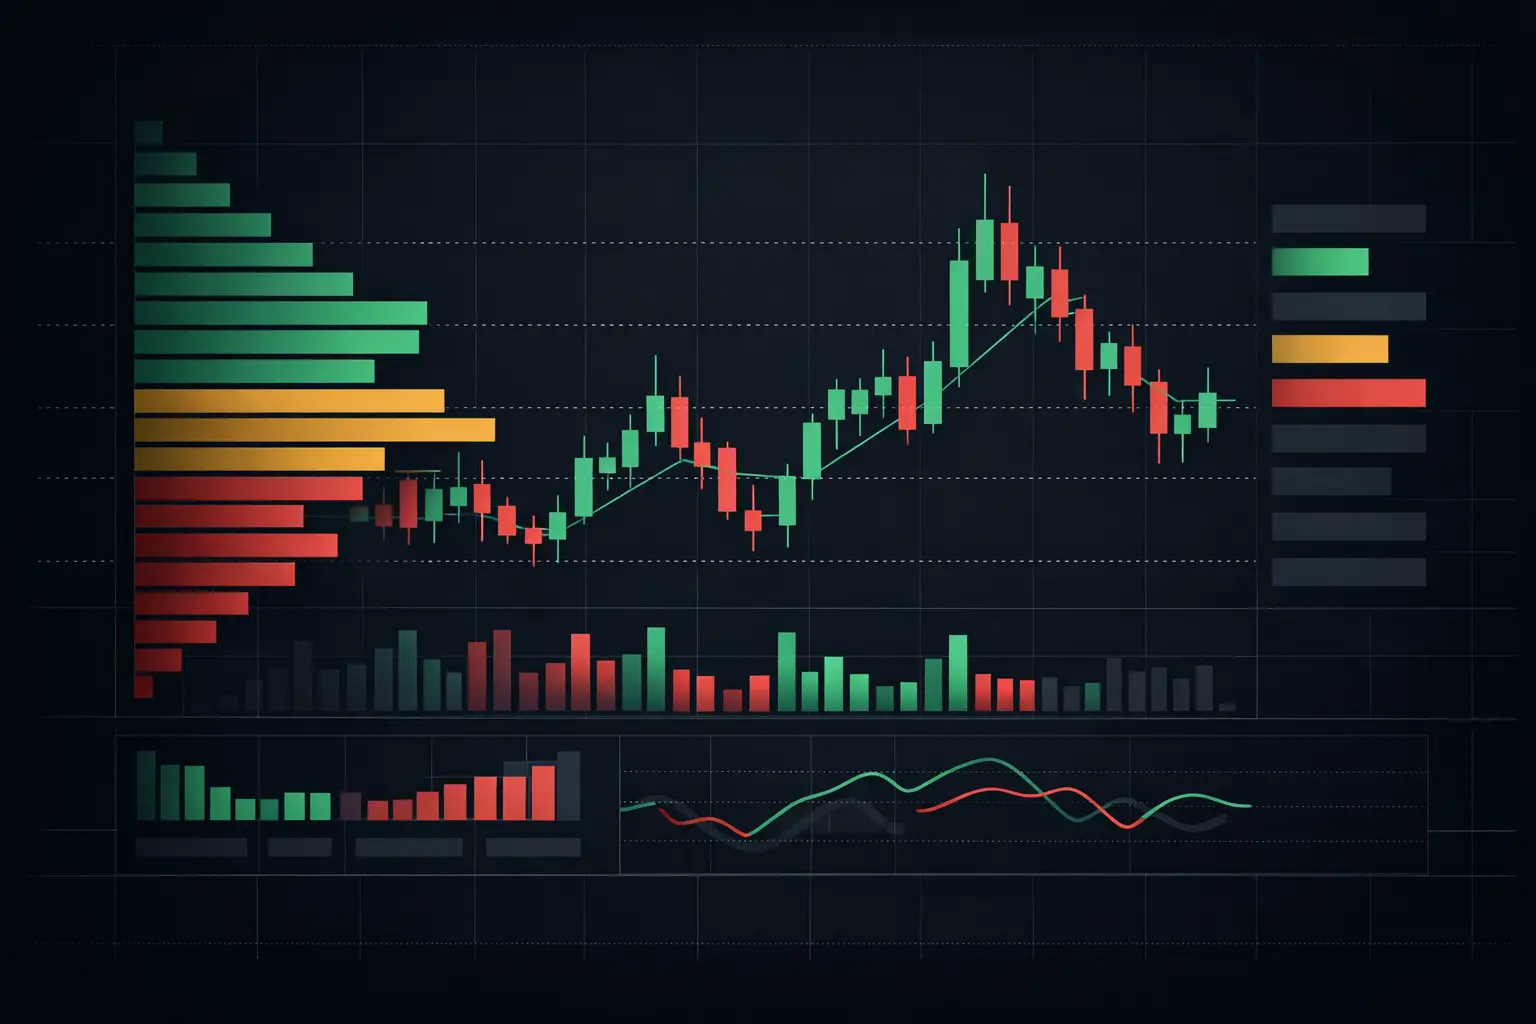
A volume profile indicator answers a question that candle charts cannot: where did the market actually conduct business? Price may travel through ten points in minutes, but volume at price reveals whether that move found acceptance, met rejection, or simply passed through thin participation.
For active futures traders, that distinction matters most when the auction accelerates. A session profile can show the levels where two-sided activity concentrated, where price moved too quickly to build volume, and where the developing auction is returning to test prior business. It turns the chart from a sequence of candle shapes into a map of participation.
What a Volume Profile Indicator Measures
A volume profile indicator organizes traded volume horizontally by price rather than vertically by time. Instead of asking how much volume occurred in a five-minute bar, it asks how much volume occurred at each individual price level during a defined session, range, or composite period.
The result is a distribution. Wider rows represent prices that attracted more trade. Narrow rows identify prices where the market spent little time and conducted comparatively little business. The shape is not decoration. It is a compact view of the auction's structure.
The most referenced level is the Volume Point of Control, or VPOC. This is the price with the highest traded volume within the selected profile. VPOC often acts as a useful reference because it marks the session's greatest concentration of activity, not because it has any fixed directional meaning. Price can rotate around it, migrate away from it, or revisit it after a fast extension. Context determines which behavior is relevant.
A standard profile also defines a value area, commonly calculated as the range containing a specified percentage of total volume around the VPOC. Value Area High and Value Area Low frame the portion of the distribution where the auction spent most of its effort. These levels become more useful when viewed alongside the profile's shape, current location, and developing volume.
Read Profile Shape Before Isolating Levels
A single VPOC or value-area boundary is easy to plot. The harder work is reading the distribution that created it. Profile shape explains whether a level formed through sustained acceptance, a brief concentration during rotation, or an unfinished auction near the edge of a session.
A balanced, bell-shaped distribution indicates that volume accumulated around a central area. Price spent time rotating, and both sides were active through a relatively contained range. In this environment, the profile's center has a different character than the edge. The center represents established business; the edges mark the points where the auction stopped extending.
A directional session often develops a more elongated or skewed profile. Volume can build progressively higher or lower as price discovers new areas of activity. That does not make every new VPOC equally meaningful. A VPOC that migrates with the developing auction reflects changing participation, while a stationary VPOC may remain the principal volume reference for the session.
Low-volume nodes deserve equal attention. These thin areas are places where price moved with limited interaction. When price revisits them, it may move through quickly again or begin building new volume there. The profile cannot decide that outcome by itself. It shows the prior absence of business. The order flow at the retest shows whether that absence remains intact.
High-volume nodes are the opposite. They are areas of acceptance where the market repeatedly traded. A high-volume node is often more informative as a zone than as one exact tick, especially in instruments with frequent rotation. Treat its width, its placement within the session, and its relationship to current volume as part of the structure.
Configure the Profile to Match the Auction
The usefulness of a profile depends heavily on its boundaries. A profile built from the full regular trading hours session answers a different question than one built from the overnight session, the opening range, or a user-defined composite. There is no universally correct period. The appropriate setting depends on the auction you want to examine.
For intraday index futures work, separate regular trading hours and overnight profiles can prevent two very different participation periods from being compressed into one distribution. The overnight profile often provides context for the opening auction, while the RTH profile shows where participation developed after the primary session began.
Developing profiles add another layer. Rather than waiting for the session to close, they update VPOC, value area, and volume distribution as new trades occur. This is useful when the market is building volume at a new location or when the developing VPOC is shifting through the session. The key is to distinguish a developing reference from a completed one. A level still accumulating volume has not finished defining its role.
Profile resolution also matters. On products with a small tick size and active tape, a one-tick profile offers the most precise view of volume placement. Larger row sizes can reduce visual noise and clarify broader structure, but they also merge distinct price levels. The best setting is not the smoothest-looking histogram. It is the one that preserves the detail required for the chart's operating timeframe.
Pair Volume Profile With Bid/Ask Detail
Volume profile shows where volume traded. Footprint data shows how it traded.
That distinction is critical around VPOC, value-area boundaries, and low-volume nodes. A profile may identify a high-volume area, but it does not show whether the participation inside that area was driven by aggressive market buying, aggressive market selling, or repeated absorption by resting liquidity. For that, traders need bid/ask volume and delta at the price level.
Consider a return to a prior session VPOC. If the footprint shows repeated aggressive selling into the level while price stops progressing lower, the tape is displaying a different condition than a clean move through the same level with expanding selling volume. The profile supplied the location. The footprint supplies the execution detail.
Diagonal imbalances make this relationship more specific. They compare ask volume at one price with bid volume one tick below, or bid volume at one price with ask volume one tick above. Stacked imbalances can reveal sustained initiative participation through a profile edge, while absorption can expose aggressive volume failing to move price through a reference.
This is where an integrated workflow matters. SidiFootprint can display footprint bars, VPOC, value areas, and dual independent profile columns in the same NinjaTrader 8 workspace. Instead of moving between disconnected studies, the trader can keep the session structure, bid/ask interaction, cumulative delta, and developing bar behavior visible together.
Use Session References Without Freezing the Chart
Prior-session VPOC, Value Area High, Value Area Low, and major volume nodes are useful because they preserve a record of completed business. They should not become static lines that override current auction conditions.
When price approaches a prior reference, watch whether volume begins building around it, whether the market moves cleanly through it, or whether aggressive activity is absorbed at the boundary. A fast test with little volume has a different profile character from an extended rotation that builds a new high-volume node around the same price.
It also helps to separate historical structure from current developing structure visually. Use distinct colors, line styles, or profile columns for prior sessions, current session activity, and composite profiles. In a fast market, visual hierarchy is not cosmetic. It determines whether critical references can be read without searching the chart.
Common Profile Errors on Fast Futures Charts
The most common error is treating every VPOC as an exact pivot. A VPOC is a volume concentration, and its relevance depends on how it formed, how old it is, and what current order flow is doing at that location. A profile created during a compressed balance has different context from a VPOC left behind during a directional extension.
Another error is using one profile period for every question. A full-session profile can obscure the opening auction. A narrow range profile can remove the larger session context. Keep separate profiles when they represent separate auctions rather than forcing all volume into one histogram.
Finally, do not read volume profile in isolation. Volume at price gives the structural map. Footprint volume, delta, imbalances, absorption, and exhaustion show the interaction occurring at the map's key locations. One without the other leaves part of the auction hidden.
A well-configured profile does not clutter the chart with more lines. It makes the existing price ladder intelligible: where volume accepted price, where it rejected it, and where the next developing auction is choosing to do business.
See it on your own chart.
Every Sidi tool is unlocked in the free 14-day demo. Install SidiFootprint in NinjaTrader 8 and load one of the finished color styles to start.
Start free 14-day demo → SidiFootprint features Browse color stylesRelated articles
VPOC Versus Session POC and What Each Shows
VPOC versus session POC is a scope question. Learn how profile boundaries, developing volume, migration, and acceptance sharpen futures chart daily context.
How to Build Dual Session Profiles in NinjaTrader
Learn how to build dual session profiles in NinjaTrader 8, separating auction context, VPOC, value area, and developing volume at a glance on one chart.
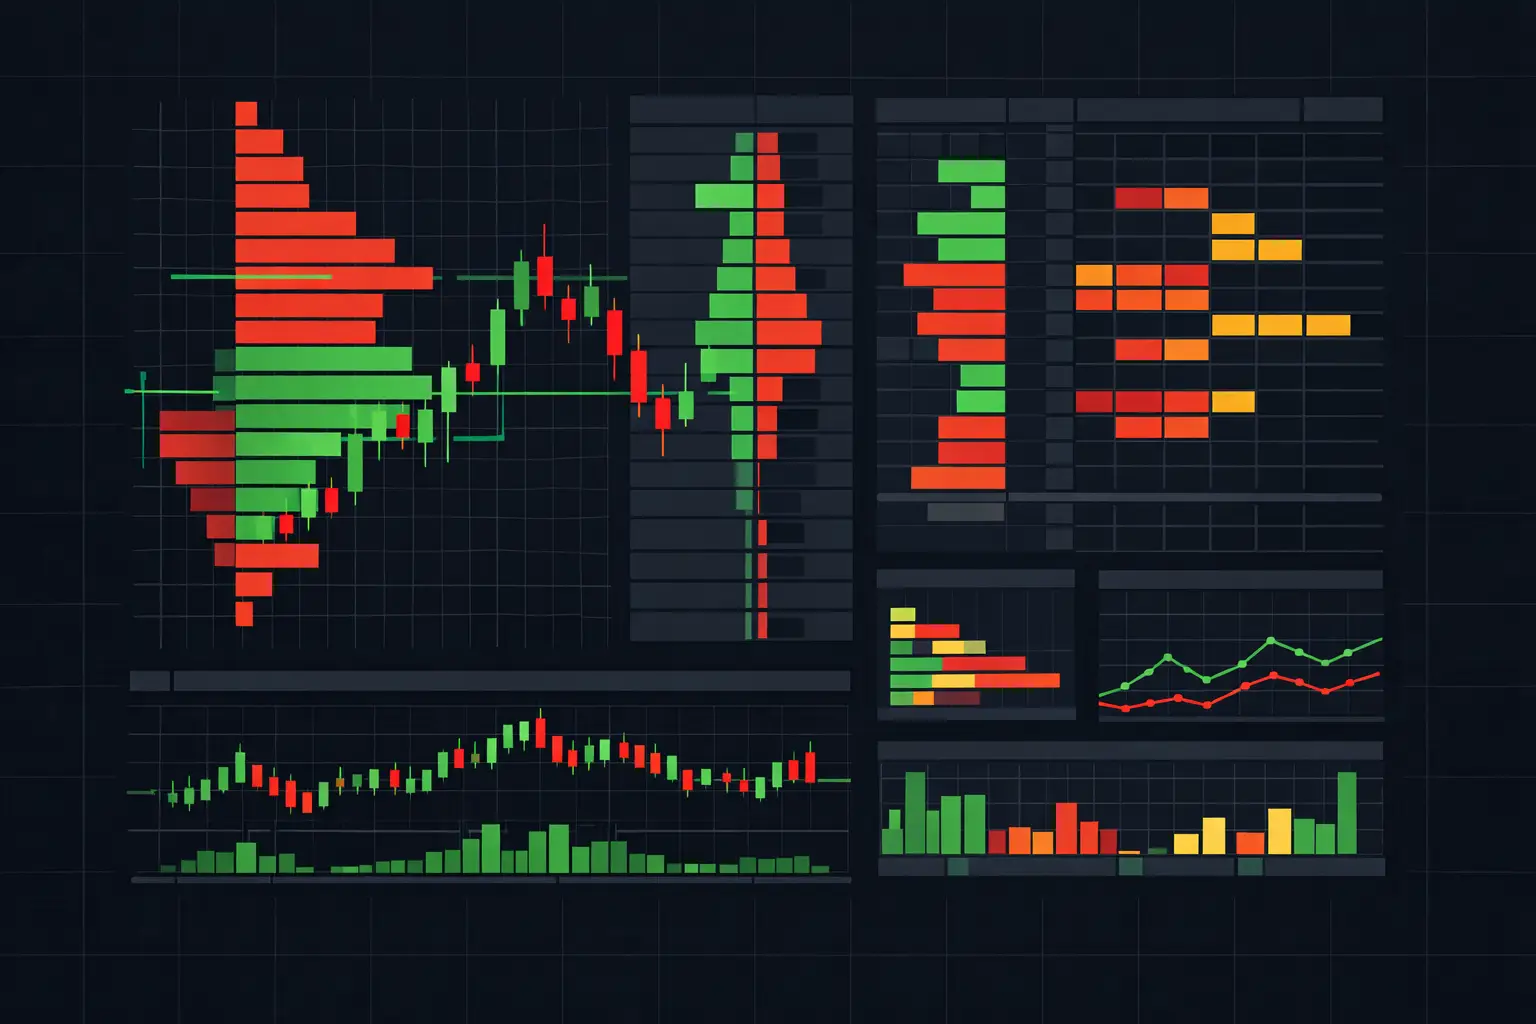
Volume Profile Software for Fast Futures Charts
Volume profile software maps traded volume by price, giving active futures traders developing VPOC, value areas, and session context in real time daily.