
VPOC Versus Session POC and What Each Shows
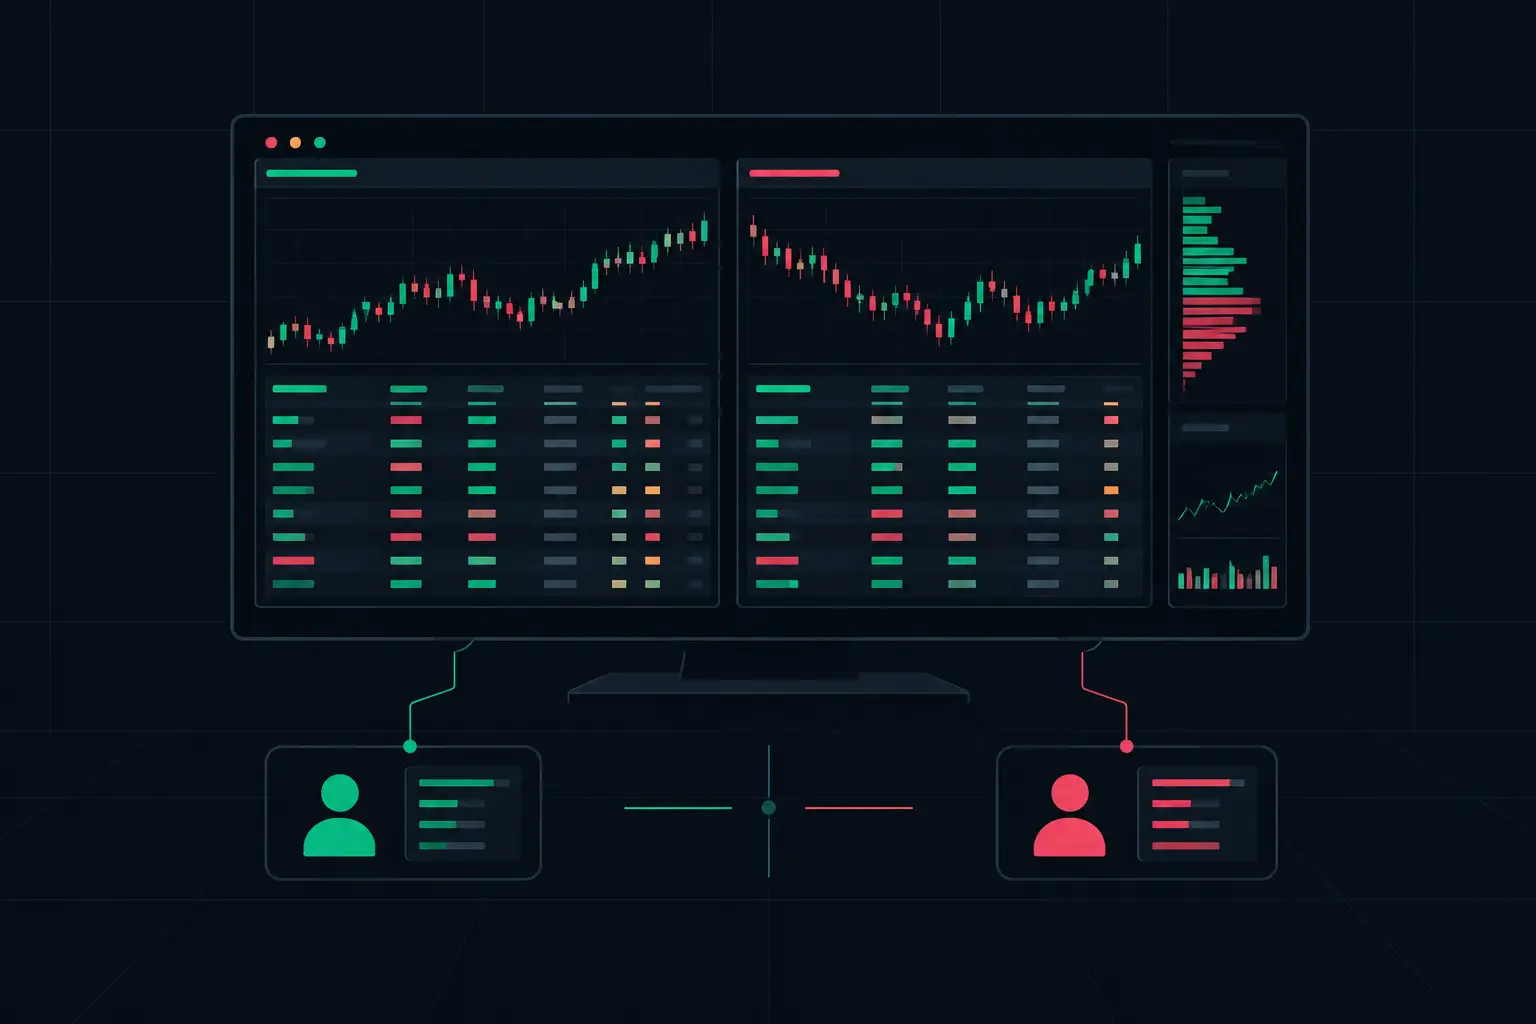
On an active ES chart, a POC line can look decisive until the profile boundary changes. That is the core of VPOC versus session POC: the calculation is often the same, but the auction being measured is not. A VPOC belongs to a defined volume profile. A session POC usually refers to the VPOC calculated across one specific trading session. If those terms are treated as interchangeable without checking the profile scope, the chart can mix short-term participation with a much broader auction.
For order-flow traders, the distinction is not semantic. It determines whether the line represents the current developing auction, the completed regular trading hours session, the overnight session, or a composite built across several sessions. Price may interact with all of those references, but each answers a different question about where volume concentrated.
VPOC Versus Session POC: The Calculation
VPOC means Volume Point of Control. It is the price level containing the greatest traded volume within a selected profile. The profile may cover one bar, a fixed range, a session, a week, a custom period, or any other defined segment. Add the bid and ask volume at every price level in that profile, then identify the level with the highest total. That level is the VPOC.
A session POC is a POC constrained by a session template. On a futures chart, that might mean the US regular trading hours session, the full electronic session, or a custom session window. When the session POC is volume-based, it is simply the VPOC of that session profile.
The useful distinction is scope:
- A VPOC describes the high-volume price of any chosen profile.
- A session POC describes the high-volume price of one session-defined profile.
That sounds straightforward, but the chart behavior can differ sharply. A 30-minute VPOC can migrate several times while a full-session POC remains fixed. A regular-hours POC may sit well above an overnight VPOC because participation concentrated in different locations. Neither reference invalidates the other. They map different auctions.
Profile Boundaries Control the Meaning
The first configuration decision is not color, line style, or label placement. It is the profile boundary. Without a clear boundary, a POC reference has no useful context.
A session profile aggregates volume from the beginning of the selected session until its end. If the profile uses regular trading hours, its POC reflects only that window. If it uses the entire electronic session, overnight volume is included. For ES and other index futures, that choice can materially change the POC because overnight rotation may build volume far from the regular-hours area.
A VPOC can be calculated from a narrower structure. A developing bar profile shows where volume is concentrating inside the current bar. A fixed-range profile can isolate an impulse, a balance area, or a specific auction leg. A composite profile can combine several completed sessions and expose the price that accumulated the most volume across the entire selected range.
The same price may be VPOC in multiple profiles. That confluence is more descriptive than a single line alone: it shows that volume concentrated at the same level across multiple time boundaries. Conversely, widely separated VPOCs show that participation was distributed across distinct auctions rather than centered around one price.
Developing VPOC Is Not a Finished Reference
A developing session POC moves while the session is still building. Each new transaction can add volume to an existing price or elevate another price above it. On fast tape, that migration can occur repeatedly, especially when several nearby prices carry similar total volume.
That makes the developing POC valuable as a live measure of where the auction is currently concentrating. It also means it should not be read like a completed-session POC. A final session POC is fixed once the profile closes. A developing session POC remains conditional on the volume that has traded so far.
The distinction becomes especially relevant near the session open. Early volume can establish a temporary POC quickly, yet later two-way trade can build a much larger concentration elsewhere. Viewing the developing profile beside completed session references prevents an early location from being confused with the session’s eventual volume center.
SidiFootprint can place profile information directly alongside bid/ask activity, so POC migration can be read with the footprint rather than as an isolated horizontal line. If a developing POC shifts higher while ask-side volume expands through successive price levels, the profile is showing concentration moving upward. If the POC remains stationary while large volume prints repeatedly at that level, the footprint provides the detail needed to inspect whether aggressive volume is being absorbed or whether trade is simply rotating around the area.
VPOC Is Volume-Based, but POC Labels Need Verification
Not every study using the label POC is necessarily calculating volume POC. Some market-profile tools define POC from time-price opportunities rather than traded volume. In that case, the POC identifies the price visited during the greatest number of time brackets, not the price with the greatest contract volume.
For order-flow work, that distinction matters. A time-based POC can sit at a different level from VPOC when trade repeatedly revisits one price but the largest volume prints elsewhere. A chart layout should state which methodology is in use and keep labels unambiguous.
Tie handling also matters. Two price levels can finish with identical total volume. The platform must use a rule to select or display the POC, such as favoring the level closest to the profile’s midpoint or showing both tied levels. This is a small implementation detail until the profile is tightly balanced. Then a one-tick difference can change which price receives the visual POC marker.
How to Read POC Location With Order Flow
A POC does not explain participation by itself. It identifies where the most volume occurred, but it does not separate aggressive buying from aggressive selling. The footprint does that work.
At a session POC, compare bid volume, ask volume, delta, trade count, and imbalance structure. Heavy total volume with limited price progress may show a two-way auction or passive absorption. Heavy volume accompanied by repeated diagonal ask imbalances and upward displacement describes a different condition. The VPOC is the location; the footprint shows what actually traded there.
Context also matters when price revisits a completed POC. A return to a prior session POC can occur with low participation, aggressive volume, or broad rotation. The line remains the same, but the auction arriving at it is different. Reading current bid/ask behavior around that reference keeps the chart anchored to present participation rather than treating every POC touch as identical.
Value area adds another layer. The VPOC is one price, while value area defines the range containing the configured percentage of profile volume around that center. A session POC near the middle of value describes a balanced volume distribution. A VPOC near a value-area edge can reveal an uneven profile, particularly when the surrounding footprint shows initiative trade extending away from the area.
Configure Session Definitions Before Comparing Levels
Before comparing VPOC and session POC on NinjaTrader 8, set the trading-hours template deliberately. Confirm whether the session begins at the electronic reopen, the regular-hours open, or a custom time. Then decide whether the chart should display the developing POC, completed POCs, or both.
For a clean workspace, use distinct visual treatment for each scope. A developing session POC should look different from prior completed session POCs. Composite VPOCs should be identifiable at a glance. If profiles are shown in dual independent columns, one column can hold the current session while the other holds a larger composite or prior session reference. The point is not to add lines. It is to ensure every displayed line has a known auction boundary.
Also keep contract roll and data continuity settings consistent. A composite VPOC built across mismatched contract data can distort the volume distribution. Session boundaries, tick size, and the selected instrument must remain aligned with the footprint data feeding the profile.
The clearest chart is not the chart with the most POC references. It is the chart where every VPOC has a defined profile, every session POC has a declared session template, and current order flow explains how volume is behaving at those prices.
See it on your own chart.
Every Sidi tool is unlocked in the free 14-day demo. Install SidiFootprint in NinjaTrader 8 and load one of the finished color styles to start.
Start free 14-day demo → SidiFootprint features Browse color stylesRelated articles
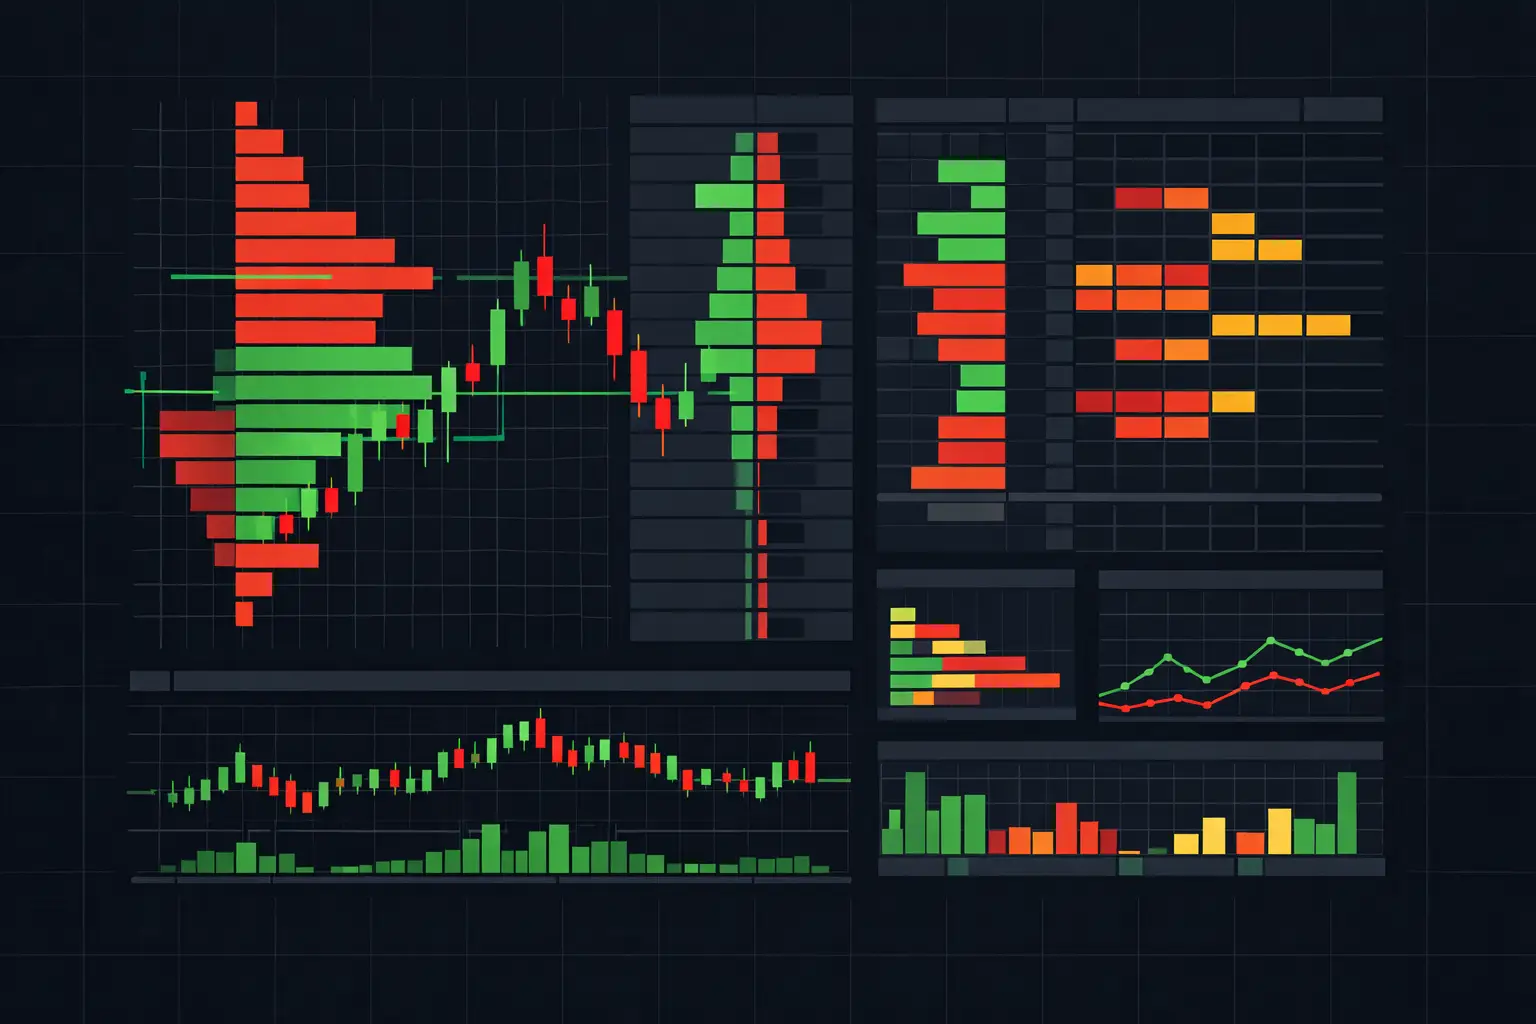
Volume Profile Software for Fast Futures Charts
Volume profile software maps traded volume by price, giving active futures traders developing VPOC, value areas, and session context in real time daily.
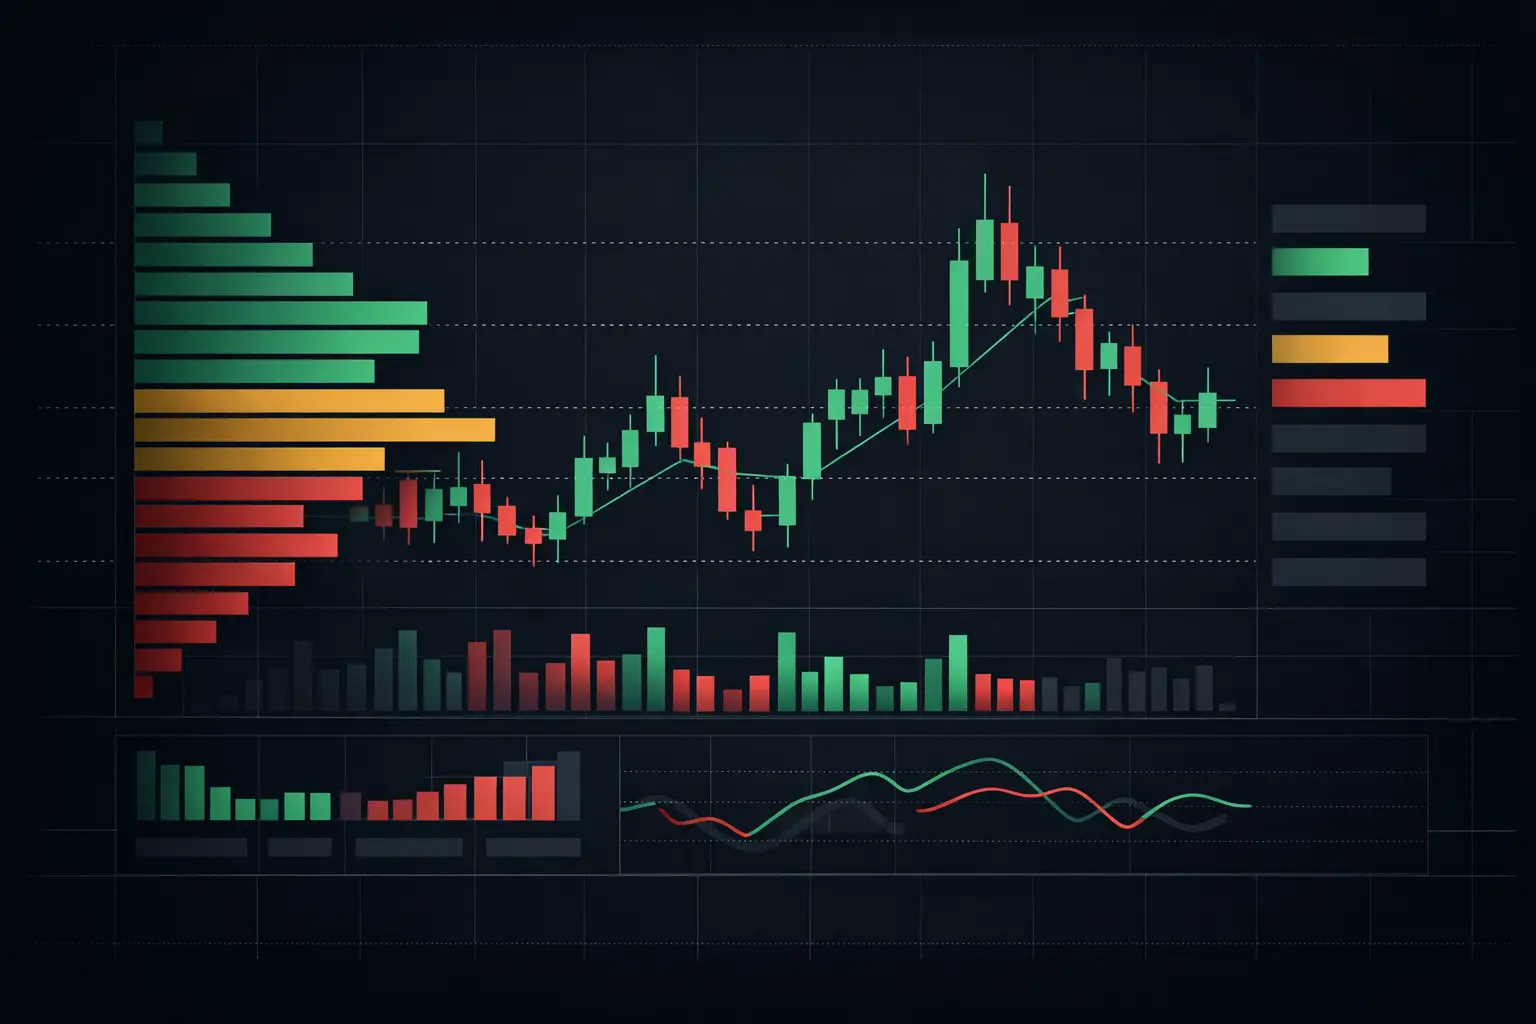
Volume Profile Indicator for Faster Context
Use a volume profile indicator to map VPOC, value area, and high-volume acceptance across each futures session with precise auction context during RTH.
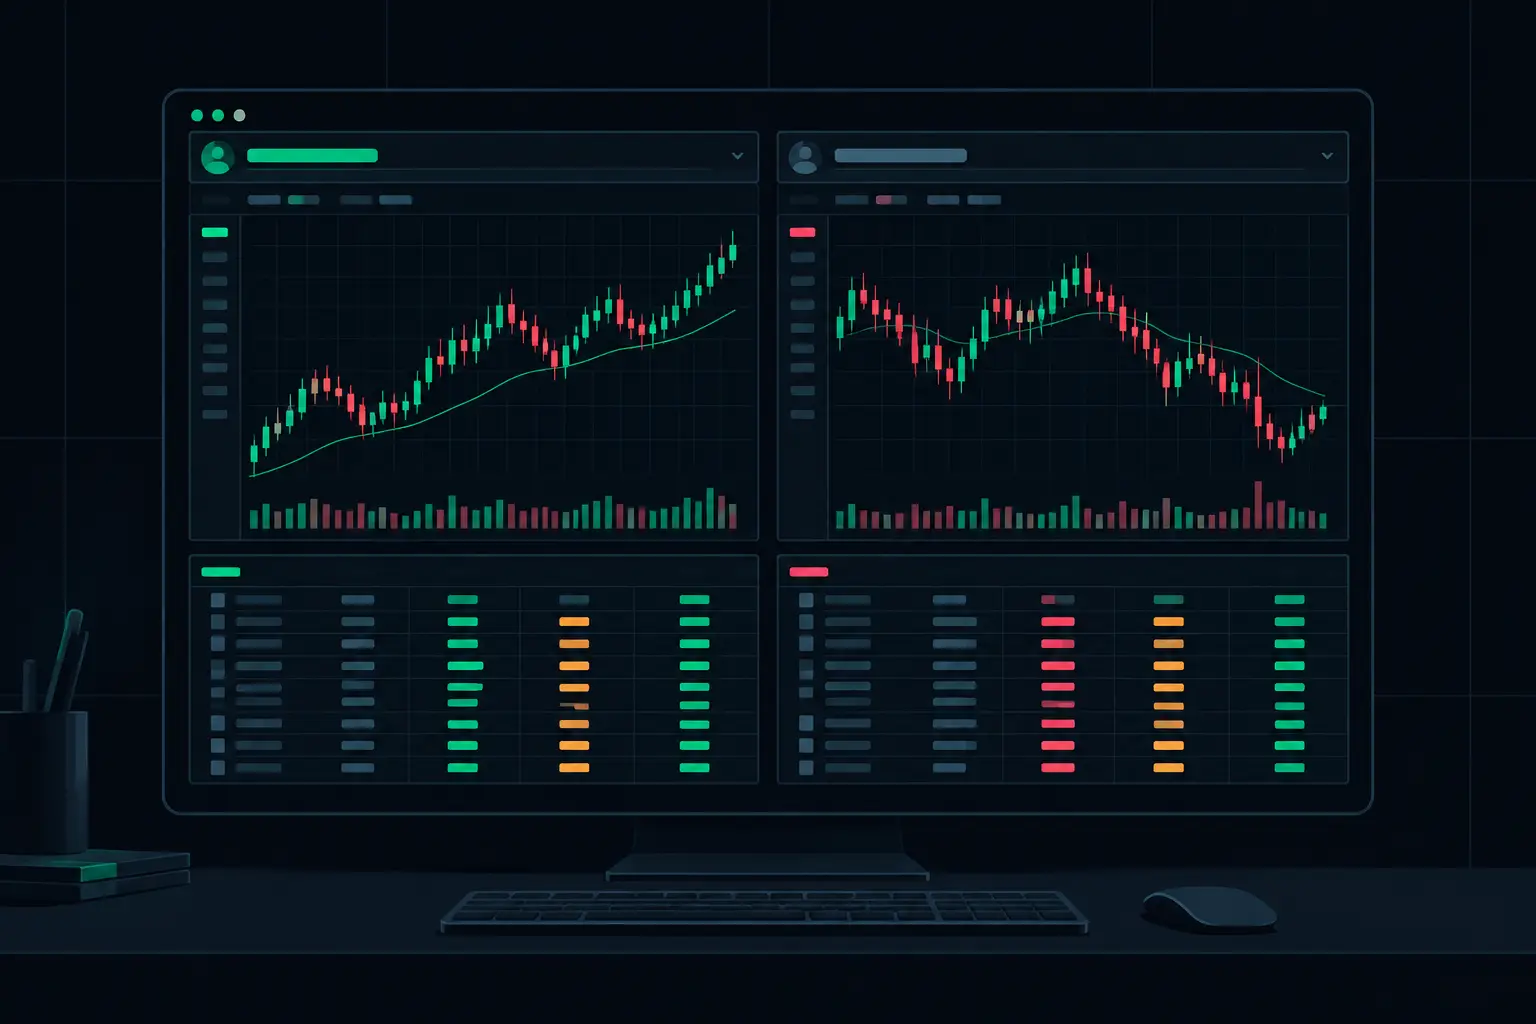
How to Build Dual Session Profiles in NinjaTrader
Learn how to build dual session profiles in NinjaTrader 8, separating auction context, VPOC, value area, and developing volume at a glance on one chart.