
Volume Profile Software for Fast Futures Charts
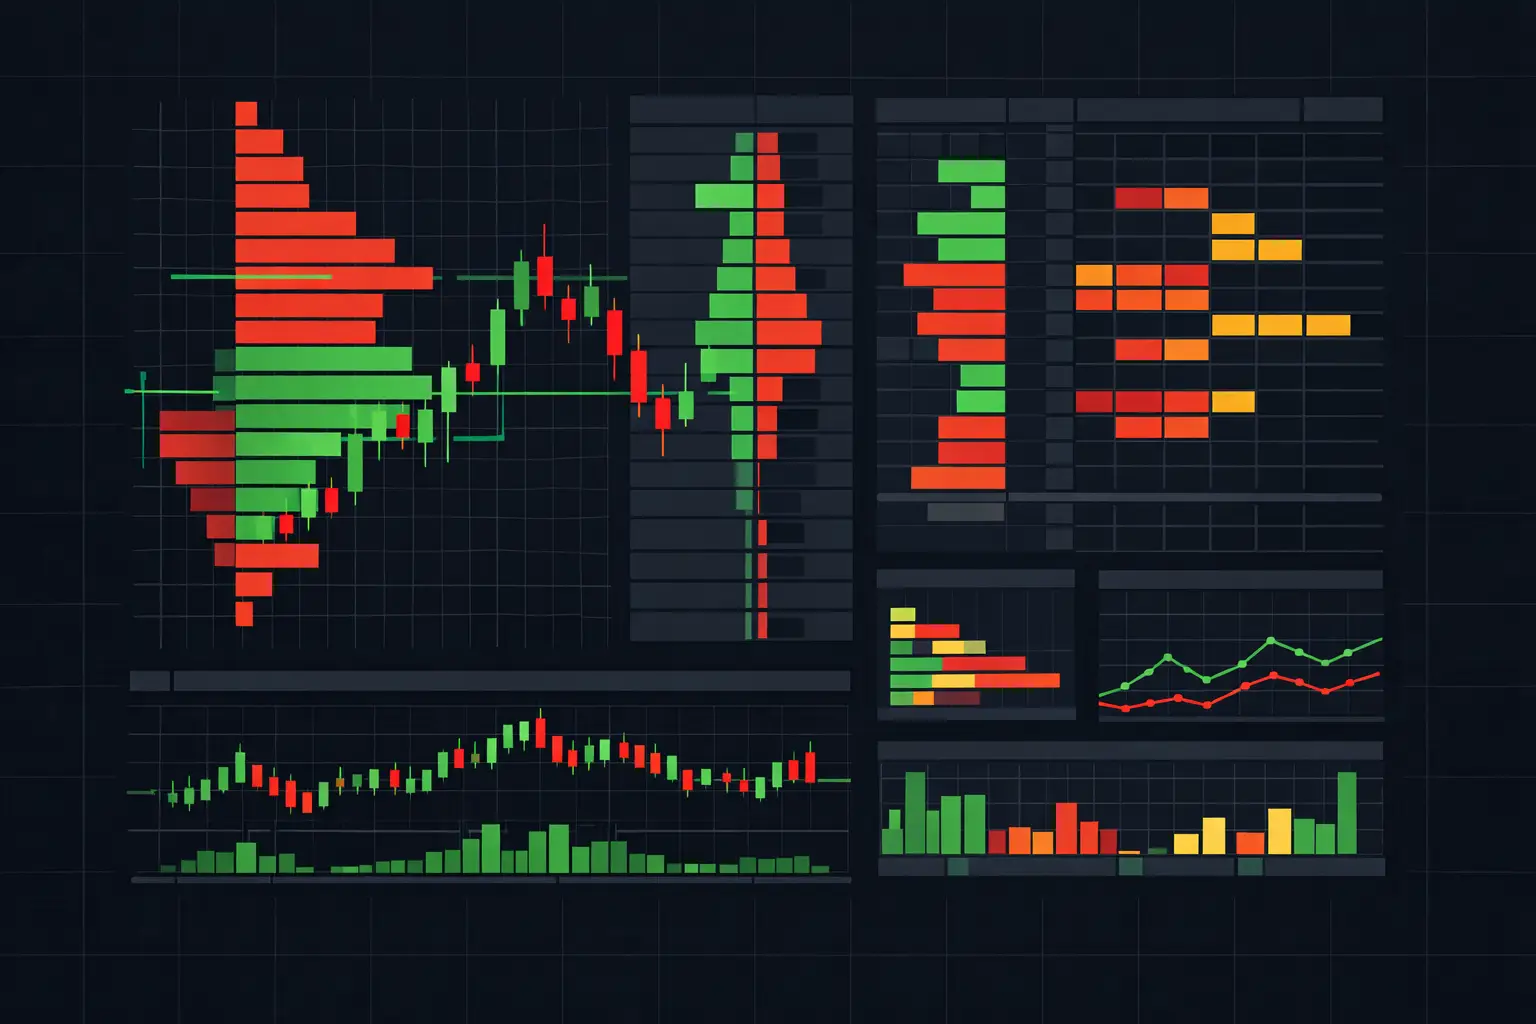
A candle can show where price opened and closed. It cannot show how much business occurred at each price inside that move, where two-sided auction developed, or whether the session is building acceptance above or below a key level. Volume profile software fills that gap by organizing traded volume vertically by price rather than horizontally by time.
For active futures charts, that distinction is operational. A developing VPOC can migrate while the market rotates. Value-area boundaries can expand, contract, or remain fixed. A high-volume node can reveal sustained participation that a fast sequence of candles compresses into a few pixels. The chart needs to calculate those changes fast enough that the developing structure remains usable while the tape is moving.
What Volume Profile Software Actually Measures
A volume profile aggregates executed volume at each price over a defined period. That period may be a session, a custom range, a bar, or a composite of multiple sessions. The resulting histogram answers a direct question: at which prices did the market do the most work?
The largest volume row is the Volume Point of Control, or VPOC. It is the price with the highest traded volume in the selected profile. Value Area High and Value Area Low define the price range containing a chosen percentage of total volume, commonly 68%, 70%, or another configurable value. Outside that range, volume distribution often thins. Inside it, the auction has spent more time facilitating trade.
Those labels are simple. Their usefulness depends on how the profile is built and displayed. A fixed session profile is historical context. A developing session profile is live context. A profile based only on total volume gives one view of participation; a profile beside bid/ask footprint data adds the aggressive side of the auction at each price.
That is why profile analysis belongs in the same workspace as order flow. A VPOC tells you where volume accumulated. Bid and ask volume, delta, stacked imbalances, absorption, and exhaustion show how that accumulation formed.
The Difference Between a Static Profile and a Developing Auction
Static profiles are clean after a session closes. They are less informative when used alone during the session itself. The critical behavior is often not the final position of the VPOC but its path: whether it holds, steps higher, steps lower, or relocates abruptly as new volume enters the distribution.
A developing VPOC that remains stable through repeated rotation identifies a price where volume continues to transact. When it migrates, the profile is reweighting. That movement should be visible immediately, without waiting for a bar to complete or manually rebuilding the study.
Developing value areas matter for the same reason. If the value area expands upward, the chart is recording accepted volume over a broader higher range. If volume builds at the edge without the value area extending, the market may be testing that area without yet building broad acceptance there. These are different auction conditions, and a fixed profile drawn after the fact cannot distinguish their sequence.
Session segmentation also matters. E-mini S&P 500 futures trade across multiple market periods, and the profile used for overnight activity may need to remain separate from the regular trading hours session. One chart layout may require independent profiles for current session activity and a larger composite. Another may require a profile per bar alongside a session profile column. The software should support those choices without forcing unrelated context into one histogram.
What Execution-Grade Volume Profile Software Requires
The core calculation is only the start. For a fast futures workflow, volume profile software needs to preserve both visual clarity and processing speed as chart activity increases. A profile that refreshes slowly, overlays key rows, or restricts layout choices becomes a source of friction precisely when the market is most active.
Look first at profile scope. The tool should support session, bar, and custom-range profiles, with control over the session template and reset behavior. A profile that begins and ends at the wrong times changes its VPOC, total volume, and value area. Session definition is not cosmetic configuration.
Next, inspect how profile columns can be placed. A single fixed column is limiting when footprint cells, delta columns, cumulative delta, and profile data need to coexist. Independent profile columns allow traders to place separate volume distributions where they remain readable: for example, a session profile on one side of the chart and a bar-based profile beside the footprint ladder.
The following capabilities separate a basic histogram from a tool built for active analysis:
- Developing VPOC, Value Area High, and Value Area Low that update from incoming trades.
- Configurable value-area percentage, profile width, alignment, colors, labels, and row display.
- Independent session, bar, and composite profile views within the same chart layout.
- Integration with bid/ask volume, delta, trade count, imbalances, and other footprint calculations.
- Real-time alerts and text-to-speech events tied to defined profile and order-flow conditions.
Configuration depth matters because no two chart layouts need the same density. A trader using a 1-minute E-mini S&P 500 futures chart may need compact cells and narrow profile columns. A trader studying a slower auction may need larger fonts, extended VPOC lines, and visible value-area shading across more historical bars. The calculation can be identical while the usable display is entirely different.
Pairing Profiles With Footprint Data
Volume at price does not identify which side initiated each trade. Footprint data supplies that missing detail. At each price, bid volume represents market sells hitting the bid, while ask volume represents market buys lifting the offer. Delta is the difference between them.
Placed next to a volume profile, those metrics add structure to the distribution. A high-volume node with balanced bid and ask activity describes a different condition than a high-volume node with persistent positive or negative delta. A low-volume area that prints diagonal imbalances may show aggressive activity moving through prices that previously saw little trade.
Diagonal imbalance calculations are especially useful for retaining price-level precision. Ask volume at one price is compared with bid volume one tick below. In the opposite direction, bid volume is compared with ask volume one tick above. When the configured ratio is met across consecutive prices, stacked imbalances make the concentration visible without reducing it to a single bar color.
Absorption can provide another layer. If aggressive market orders continue to transact into a price but price does not extend, passive liquidity may be absorbing that activity. When that behavior occurs at a VPOC, value-area boundary, or prior session reference, the profile supplies the location and the footprint supplies the transaction detail. Neither view replaces the other.
SidiFootprint brings those views into a single NinjaTrader 8 chart, combining configurable footprint cells with integrated volume-profile analytics. Its dual independent profile columns are particularly practical when session structure and per-bar distribution both need to remain visible without sacrificing the order-flow ladder.
Configure for Readability Before Adding More Data
More fields do not automatically produce a better chart. A footprint chart can become unreadable when every available statistic competes for attention. Start with the profile components that define the auction structure: VPOC, value area, and the distribution itself. Then add bid/ask or delta data needed to interpret activity at those prices.
Color logic should be deliberate. Use distinct colors for the VPOC, value area, and low-volume edges. Keep positive and negative delta colors consistent across the workspace. If imbalances are displayed, set thresholds that distinguish meaningful concentration from routine two-sided activity. The purpose is to make structural changes immediately visible, not to fill the chart with decoration.
Line extension is another practical control. Extending completed-session VPOC and value-area levels into later sessions can preserve prior auction references. Limiting their extension can reduce clutter on shorter-term charts. It depends on whether the chart is built around current-session development, recurring references, or a composite view.
Test the layout during the periods it is meant to handle. A configuration that looks clean during quiet trade may compress labels, lag updates, or obscure developing bars when volume accelerates. Performance is part of chart design, not a separate technical concern.
Use the Profile as a Map, Not a Decoration
A profile becomes useful when every visible element has a defined purpose. The VPOC marks maximum traded volume for the selected range. Value-area boundaries describe where most activity has accumulated. High-volume nodes show areas of repeated exchange. Low-volume areas show prices that received comparatively little trade.
The next step is maintaining context as these levels develop. Watch whether new volume reinforces an existing node, builds a new node, or changes the value-area shape. Use the footprint to inspect what actually traded at those prices. Keep historical profiles, current-session profiles, and per-bar profiles visually distinct so the chart does not blend different time horizons into one interpretation.
The right configuration is not the one with the most studies enabled. It is the one that keeps the developing auction, the executed volume at price, and the order-flow detail legible at the exact moment the chart needs to process them.
See it on your own chart.
Every Sidi tool is unlocked in the free 14-day demo. Install SidiFootprint in NinjaTrader 8 and load one of the finished color styles to start.
Start free 14-day demo → SidiFootprint features Browse color stylesRelated articles
VPOC Versus Session POC and What Each Shows
VPOC versus session POC is a scope question. Learn how profile boundaries, developing volume, migration, and acceptance sharpen futures chart daily context.
Volume Profile Indicator for Faster Context
Use a volume profile indicator to map VPOC, value area, and high-volume acceptance across each futures session with precise auction context during RTH.
Session Volume Profile NinjaTrader Setup
Configure a session volume profile in NinjaTrader 8 to track VPOC, value area, developing distribution, and order flow at every price level with precision.