
Absorption Trading Footprint Charts Explained
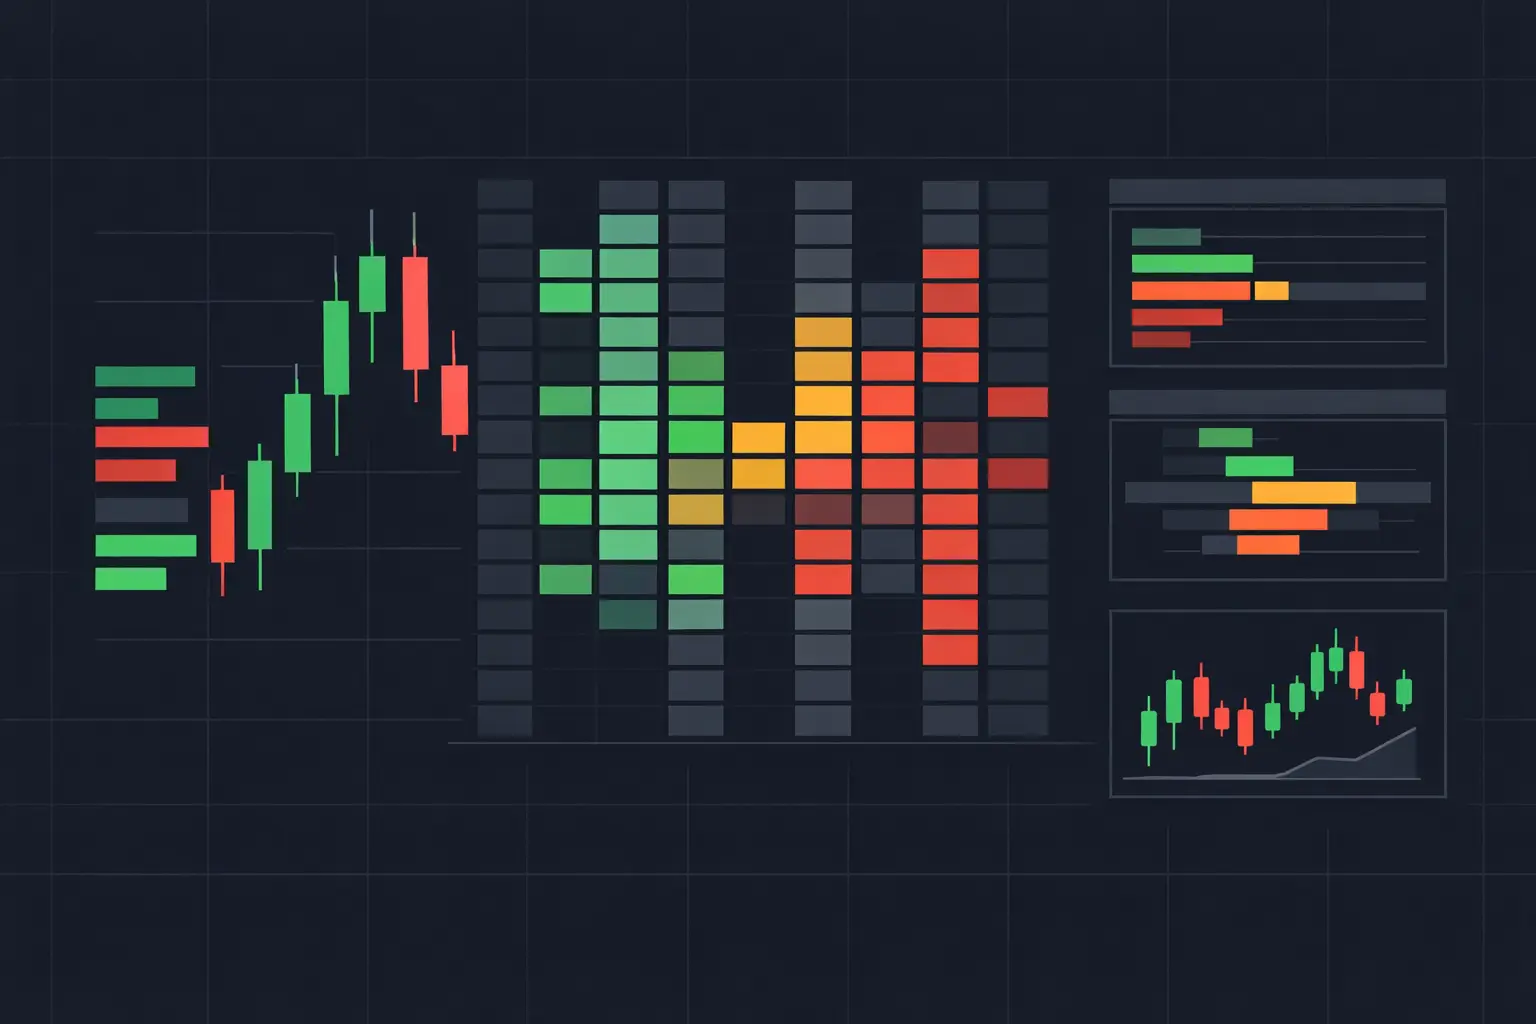
A fast E-mini S&P 500 futures auction can print heavy market-buy volume at the ask, push into an obvious high, and then fail to extend by more than a tick or two. A candle records the result. Absorption trading footprint charts show the conflict inside that result: aggressive buyers lifting offers, passive sellers replenishing liquidity, and the exact prices where that interaction held.
That distinction matters when the tape accelerates. Volume alone cannot tell you whether aggressive participation is moving the auction or being contained by resting liquidity. A footprint chart can, provided the trader reads absorption as an order-flow condition rather than a standalone directional call.
What absorption looks like on a footprint chart
Absorption occurs when aggressive market orders transact into passive limit liquidity without producing proportional price movement. At a local high, buyers may repeatedly execute at the ask while a passive seller absorbs that demand. At a local low, sellers may repeatedly hit the bid while a passive buyer absorbs supply.
The footprint makes this visible price by price. Depending on the selected display, each row can show bid volume versus ask volume, delta, total volume, number of trades, or a combination of those fields. The essential observation is not simply large volume. It is large aggressive volume concentrated at a price or narrow zone, paired with stalled development or limited follow-through beyond that level.
A high ask-volume print at the top of a developing bar is not automatically sell-side absorption. It may be initiative buying that continues to auction higher. Context determines whether the print represents containment. The same rule applies at the low: heavy bid volume can be absorbed, or it can be active selling that continues through available liquidity.
Aggression and liquidity are different sides of the trade
Every completed trade has an aggressor and a passive participant. When an order executes at the ask, the buyer initiated the transaction with a marketable order while a resting seller provided liquidity. When it executes at the bid, the seller was aggressive and a resting buyer provided liquidity.
Footprint data classifies the aggressive side. Absorption is inferred from how that aggressive activity interacts with price location, available liquidity, and subsequent auction behavior. This is why a large positive delta at a high can coexist with an inability to trade higher. The delta describes who was aggressive. It does not identify who absorbed that aggression.
That separation is central to accurate reading. Most traders stare at candles and guess whether a wick reflects rejection, exhaustion, or simple rotation. A footprint adds the executed volume behind the wick and reveals whether the auction was met by meaningful passive participation.
Absorption trading footprint charts need location
Absorption has more analytical weight at structural locations than in the middle of a balanced rotation. A large print in the center of a session value area may reflect two-way trade and inventory transfer. The same print at a prior session high, a developing VPOC, a value-area boundary, an opening range extreme, or a major composite profile level carries a different auction context.
Start with location, then inspect execution. If price tests an upper reference and ask volume expands while price cannot establish above it, the footprint may show offer absorption. If price tests a lower reference and bid volume expands with little downside progress, it may show bid absorption. The chart is documenting the response at the level, not assigning certainty to the next sequence.
A useful chart layout keeps the price ladder and profile context together. A volume profile identifies where business concentrated. The VPOC marks the highest-volume price within the selected profile. Value area shows where a defined share of volume accumulated. On a footprint, these references prevent isolated volume cells from being read without auction structure.
SidiFootprint supports footprint cells alongside independent profile columns, allowing session and composite context to remain visible while the current bar develops. That matters in fast conditions, where switching panels or rebuilding a profile view can obscure the level being tested.
Read the developing bar, not only the finished bar
Finished bars are clean, but absorption is often a developing event. At an upper extreme, ask volume may build rapidly across one or two prices. If those prices keep reloading while the bar remains unable to extend, the absorption condition becomes increasingly clear. If price accepts above the zone, the earlier interpretation must change with the auction.
Real-time visualization is therefore more useful than a static review alone. Watch whether the high or low continues to migrate, whether the same price accepts repeated volume, and whether delta expands while range fails to expand. The relationship between volume, delta, and range is the key observation.
A narrow bar with unusually high total volume is not inherently absorption. It can also reflect a balanced, high-participation auction. The evidence becomes stronger when the volume is concentrated at an extreme, aligned with a structural reference, and followed by clear inability to continue through that price.
Confirm the condition with delta and imbalances
Delta measures ask volume minus bid volume. Positive delta indicates more volume executed at the ask; negative delta indicates more volume executed at the bid. In an absorption study, delta provides the aggressive-pressure component of the read.
For example, a bar may close near its high with positive delta, yet its uppermost price prints extreme ask volume several times without expanding. That does not negate the positive delta. It highlights a potential mismatch between aggressive buying and upward progress. Conversely, a bar near its low with strongly negative delta can show aggressive selling meeting responsive passive demand.
Diagonal imbalances add another layer. A diagonal ask imbalance compares ask volume at one price with bid volume one tick below. A diagonal bid imbalance compares bid volume at one price with ask volume one tick above. Stacked imbalances show aggressive participation across consecutive price levels rather than at a single cell.
Stacked ask imbalances pressing into a high can indicate intense initiative activity. If that pressure is absorbed at the extreme and price fails to accept higher, the chart shows a more complete story than a candle or delta histogram. But stacked imbalances can also accompany continuation. Their value depends on whether the auction holds above the area, rotates back through it, or remains contained at the edge.
Cumulative delta can provide broader session context. If cumulative delta has climbed steadily while price is stalled beneath an upper reference, the divergence may frame the local absorption event. It should not replace the footprint. Cumulative delta aggregates participation; the footprint identifies the prices where it occurred.
Configure the chart for fast recognition
Absorption is easy to miss when the footprint is visually overloaded. A practical setup emphasizes the fields needed for the instrument and timeframe rather than displaying every available statistic. Bid x ask volume is usually the primary view, with delta or total volume as a secondary field. Color thresholds should be calibrated to the instrument's normal activity so ordinary cells do not receive the same emphasis as exceptional ones.
Use separate visual treatments for high-volume cells, imbalance cells, bar delta, and VPOC. If every condition uses a saturated color, the chart loses hierarchy. The goal is to identify what changed at a specific price without searching through decorative formatting.
For absorption work, configure alerts around conditions that can be objectively defined: unusual volume at a bar extreme, stacked imbalance into a reference level, delta thresholds, or a developing VPOC shift. Text-to-speech can keep attention on the order flow when the chart is not the active window. The alert should draw attention to an event, while the footprint and profile determine its context.
Session templates also matter. RTH and ETH profiles describe different auctions and can produce different volume distributions around the same price. A level that appears as a session VPOC in one template may be insignificant in another. Keep the profile definition consistent with the auction being analyzed.
Common reading errors
The most frequent error is labeling every large opposing print as absorption. A footprint records completed transactions, not displayed orders that were canceled before execution. It cannot directly show every liquidity action outside the executed tape. Absorption is a conclusion built from execution, location, and limited price progress.
Another error is treating a single bar as self-contained. A local high can absorb buying for several bars before price accepts higher. A low can absorb selling, rotate upward, and later retest with a different response. Mark the price zone, then observe how subsequent bars transact around it.
Finally, avoid fixed thresholds across all sessions. A volume value that stands out during midday rotation may be ordinary during the open or around scheduled economic releases. Relative thresholds, session-aware profiles, and instrument-specific color settings preserve the meaning of exceptional activity.
The strongest absorption read is rarely one bright cell. It is a precise sequence: aggressive volume reaches a meaningful location, passive liquidity contains it, range fails to extend, and the footprint shows exactly where the auction stopped behaving as the candle suggested.
See it on your own chart.
Every Sidi tool is unlocked in the free 14-day demo. Install SidiFootprint in NinjaTrader 8 and load one of the finished color styles to start.
Start free 14-day demo → SidiFootprint features Browse color stylesRelated articles
Delta Divergence Charts for Faster Auction Context
Delta divergence charts expose disagreement between price and aggressive volume, helping futures traders read absorption, exhaustion, and auction context.
What Causes Footprint Absorption at Key Levels?
Learn what causes footprint absorption in futures, how passive liquidity absorbs aggression, and how delta, volume, and price response expose it live.
Futures Footprint Interpretation Guide for Traders
This futures footprint interpretation guide explains delta, imbalances, VPOC, absorption, and developing profiles for auction context in NinjaTrader 8.