
Delta Divergence Charts for Faster Auction Context
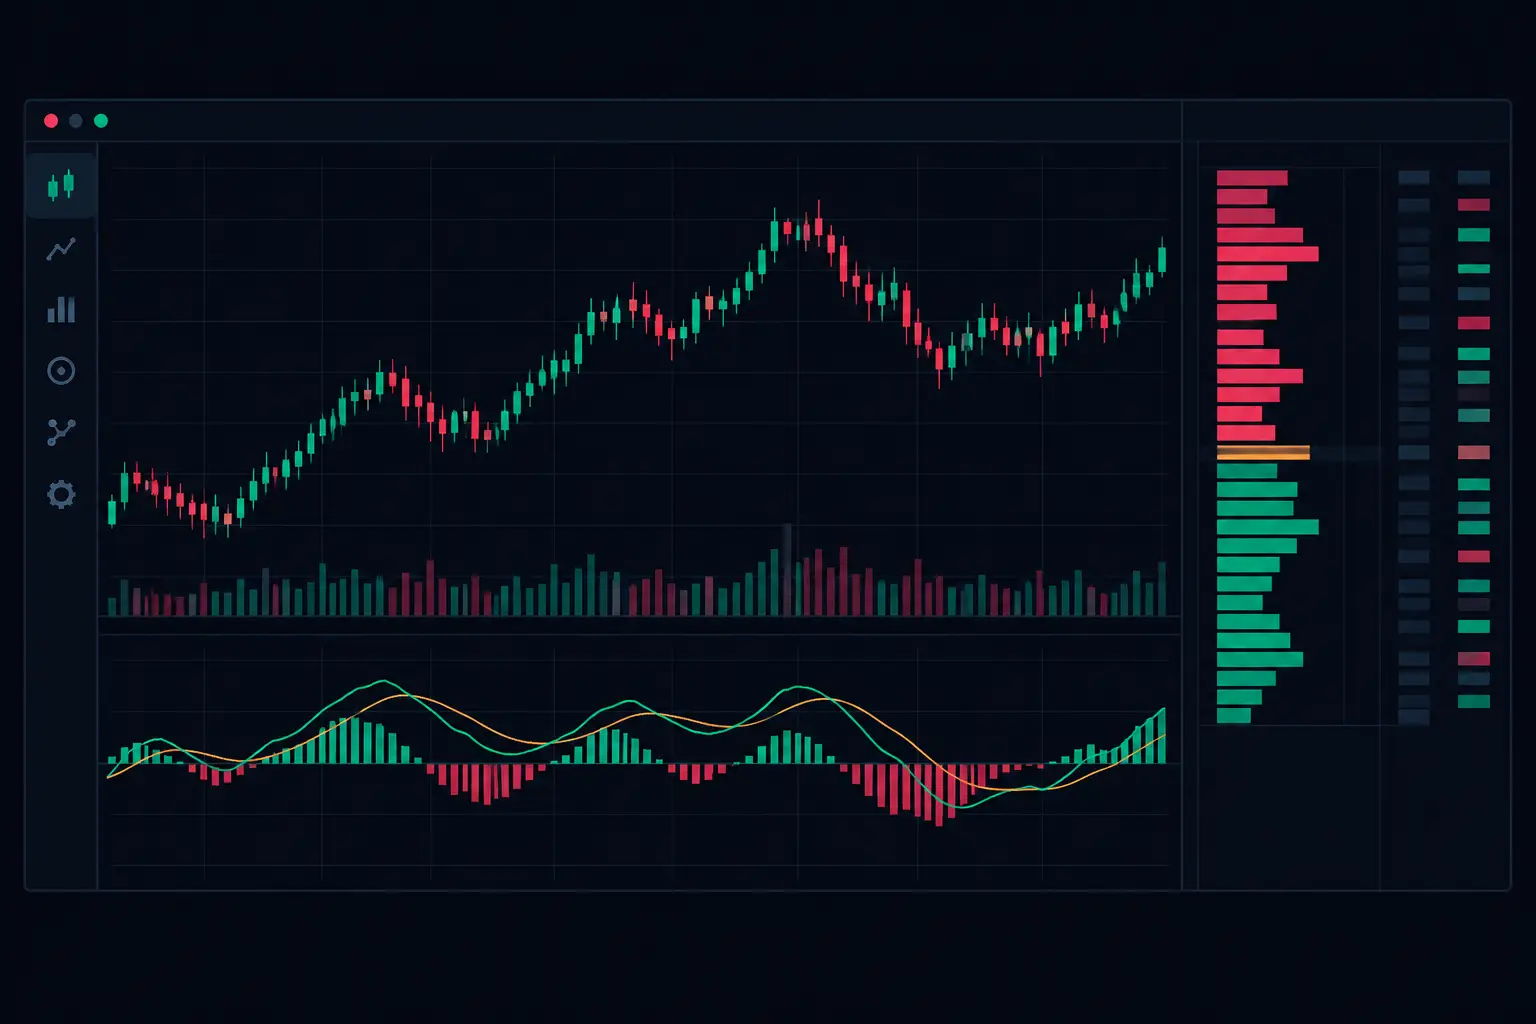
A new high in the E-mini S&P can look decisive on a candle chart while the footprint shows a thinner push from aggressive buyers than the prior auction leg. That disagreement is where delta divergence charts earn their screen space. They expose the relationship between price location and the market orders that actually lifted offers or hit bids, rather than treating every new extreme as equivalent.
Delta divergence is not a standalone verdict on direction. It is auction context. Its value comes from identifying when price is extending while aggressive participation is failing to confirm that extension, then measuring whether passive liquidity, volume structure, and subsequent developing bars validate the change in behavior.
What Delta Divergence Charts Measure
Bar delta is the difference between volume transacted at the ask and volume transacted at the bid. Positive delta means more volume lifted the offer. Negative delta means more volume hit the bid. Cumulative delta carries that imbalance forward across a defined session or calculation period, making the pressure behind a sequence of bars easier to inspect.
A delta divergence occurs when price and delta do not confirm one another. Price may print a higher high while bar delta or cumulative delta prints a lower high. Price may press to a lower low while negative delta contracts, or while buyers are increasingly active at the offer. The chart is not saying that an extreme must fail. It is showing that the aggressive side is no longer producing the same auction result.
That distinction matters because delta measures aggression, not intent. A large positive delta at a high can represent buyers forcing trades through the offer. It can also reveal a passive seller absorbing that demand without allowing price to continue efficiently. The footprint provides the price-level evidence needed to separate those conditions.
Price Can Extend on Less Aggression
The cleanest bearish-style divergence condition is a higher price high paired with weaker positive delta than the prior high. If the latest high requires less aggressive buying to trade higher, the auction may be losing initiative. But the context determines whether that weakness matters.
A thin overnight extension and a high-volume regular-session auction should not be read the same way. A divergence near a prior session high, value-area edge, composite VPOC, or known liquidity zone carries more structural relevance than one forming in the middle of rotational trade. Delta is most useful when anchored to a meaningful location.
The inverse condition appears at lows. Price can probe lower while selling delta becomes less negative, or while positive delta develops into the low. If bid-side aggression is no longer driving efficient lower prices, inspect the footprint for responsive buyers, exhaustion, and the ability of price to reclaim nearby traded volume.
Why Candles Hide the Critical Detail
Most traders stare at candles and guess whether the move was accepted. A candle shows the result of the auction: open, high, low, and close. It does not show whether the high was built on sustained ask-side aggression, whether that aggression was absorbed, or whether the final extension traded on a handful of prints.
A footprint chart resolves that ambiguity at each price. Bid volume, ask volume, delta, total volume, and trade count can be displayed in the same developing bar. Instead of seeing only a green candle at a high, you can inspect whether ask volume expanded, whether diagonal imbalances stacked upward, and whether a large sell-side response appeared immediately above or below the extreme.
For delta divergence charts, this price-level granularity prevents a common mistake: treating lower delta at a high as weakness without checking the structure of the bar. A bar can close with modest net delta while containing substantial two-way activity. It can also close with strong positive delta while price barely advances because passive offers are replenishing. Net delta is the starting point. The footprint is the explanation.
Absorption Changes the Read
Absorption is the critical companion to divergence. At an upper extreme, repeated aggressive buying may transact at the ask while price stops advancing. Large ask prints, limited upward progress, and a responsive sell imbalance can indicate that passive supply is accepting the buying pressure. At a lower extreme, large bid-side volume with limited downside progress can show passive demand absorbing sellers.
This is why a divergence should be read across more than one bar. A single lower-delta high may simply reflect a quieter pullback-and-retest sequence. A sequence of diminished positive delta, failed continuation, and visible absorption at a reference level carries far more informational weight than an isolated comparison.
Configure Delta Divergence Charts Around the Auction
The most effective layout keeps the delta study and the footprint tied to the same bar construction. If price is displayed in volume-based bars, calculate and inspect delta on those same volume-based bars. If the chart uses time bars, understand that the delta comparison is being compressed into fixed intervals that may contain very different auction conditions.
For fast index futures, bar type changes what a divergence means. Smaller bars expose microstructure shifts but create more noise and more apparent divergences. Larger bars reduce noise but can hide the exact price level where absorption began. There is no universal setting. The useful choice depends on whether the chart is being used to study a local rotation, an intraday range boundary, or a broader session auction.
In SidiFootprint, keep the visual hierarchy disciplined. Place bid-by-ask or delta values directly in the footprint, then use a cumulative delta display where it can be compared with price swings without covering the profile. Use color thresholds to emphasize material delta rather than coloring every small imbalance. When every cell is highlighted, nothing is prioritized.
A practical chart can combine the footprint with session volume profile, developing VPOC, value area, and cumulative delta. This lets you see whether a divergence is occurring at an arbitrary price or at a location where the session has already established meaningful trade. Dual independent profile columns can also separate session structure from a larger composite view, avoiding the need to choose between immediate and higher-timeframe context.
Read Divergence With Imbalances and VPOC
Diagonal imbalances show whether aggression is concentrated from one price to the next. An ask imbalance compares ask volume at one price with bid volume one tick below. A bid imbalance compares bid volume at one price with ask volume one tick above. Stacked imbalances show sustained initiative rather than a single large print.
When price makes a new high with weaker cumulative delta, inspect whether upward stacked ask imbalances are still present. If they are absent, the high may lack the broad aggressive participation seen earlier. If they remain strong but price cannot advance, the more relevant condition may be absorption. These are different auction states even when the divergence label is the same.
VPOC adds another layer. A divergence at the developing VPOC can reflect two-way acceptance and churn rather than exhaustion. A divergence at a thin edge far from VPOC may show a failed extension back toward the session's most actively traded area. Neither observation is a forecast. It is a way to classify whether the market is accepting, rejecting, or re-auctioning a price zone.
Use Cumulative Delta Carefully
Cumulative delta is powerful because it reveals persistent initiative that individual bars can obscure. It is also easy to misread when its reset period is arbitrary. A session reset is often appropriate for intraday auction analysis because it separates current participation from prior-session flow. A longer accumulation period may be useful for multi-session structure, but it can make current changes less visible.
Keep reset logic consistent when comparing highs and lows. A cumulative delta high formed before a session reset cannot be directly compared with one formed after it. Likewise, holiday conditions, low-liquidity periods, and contract-roll transitions can distort normal participation patterns. Delta is a record of executed bid and ask volume, not a substitute for understanding the session environment.
What Makes a Divergence Worth Attention
The most informative divergences are not merely price-versus-delta mismatches. They occur at a clear auction reference, show a recognizable change in aggressive participation, and are supported or challenged by the footprint after the extreme is printed.
Ask three operational questions: Did price extend efficiently? Did delta confirm that extension? What happened at the exact prices where the extension stopped? The first question measures result, the second measures aggression, and the third reveals the interaction between aggressive and passive participants.
If the answer is mixed, keep the chart mixed. A precise order-flow display should preserve uncertainty when the auction has not resolved it. Delta divergence charts are most useful when they replace a simplistic candle interpretation with a sharper view of what actually traded at the level, and whether that participation changed as price tested the edge.
See it on your own chart.
Every Sidi tool is unlocked in the free 14-day demo. Install SidiFootprint in NinjaTrader 8 and load one of the finished color styles to start.
Start free 14-day demo → SidiFootprint features Browse color stylesRelated articles
Absorption Trading Footprint Charts Explained
Absorption trading footprint charts expose passive liquidity absorbing aggressive orders, helping futures traders read stalled auctions as it unfolds.
Bid Ask Volume Indicator NinjaTrader Explained
Use a bid ask volume indicator NinjaTrader chart to expose volume, delta, imbalances, absorption, and profile context at every price level across futures.
Futures Footprint Interpretation Guide for Traders
This futures footprint interpretation guide explains delta, imbalances, VPOC, absorption, and developing profiles for auction context in NinjaTrader 8.