
Bid Ask Volume Indicator NinjaTrader Explained
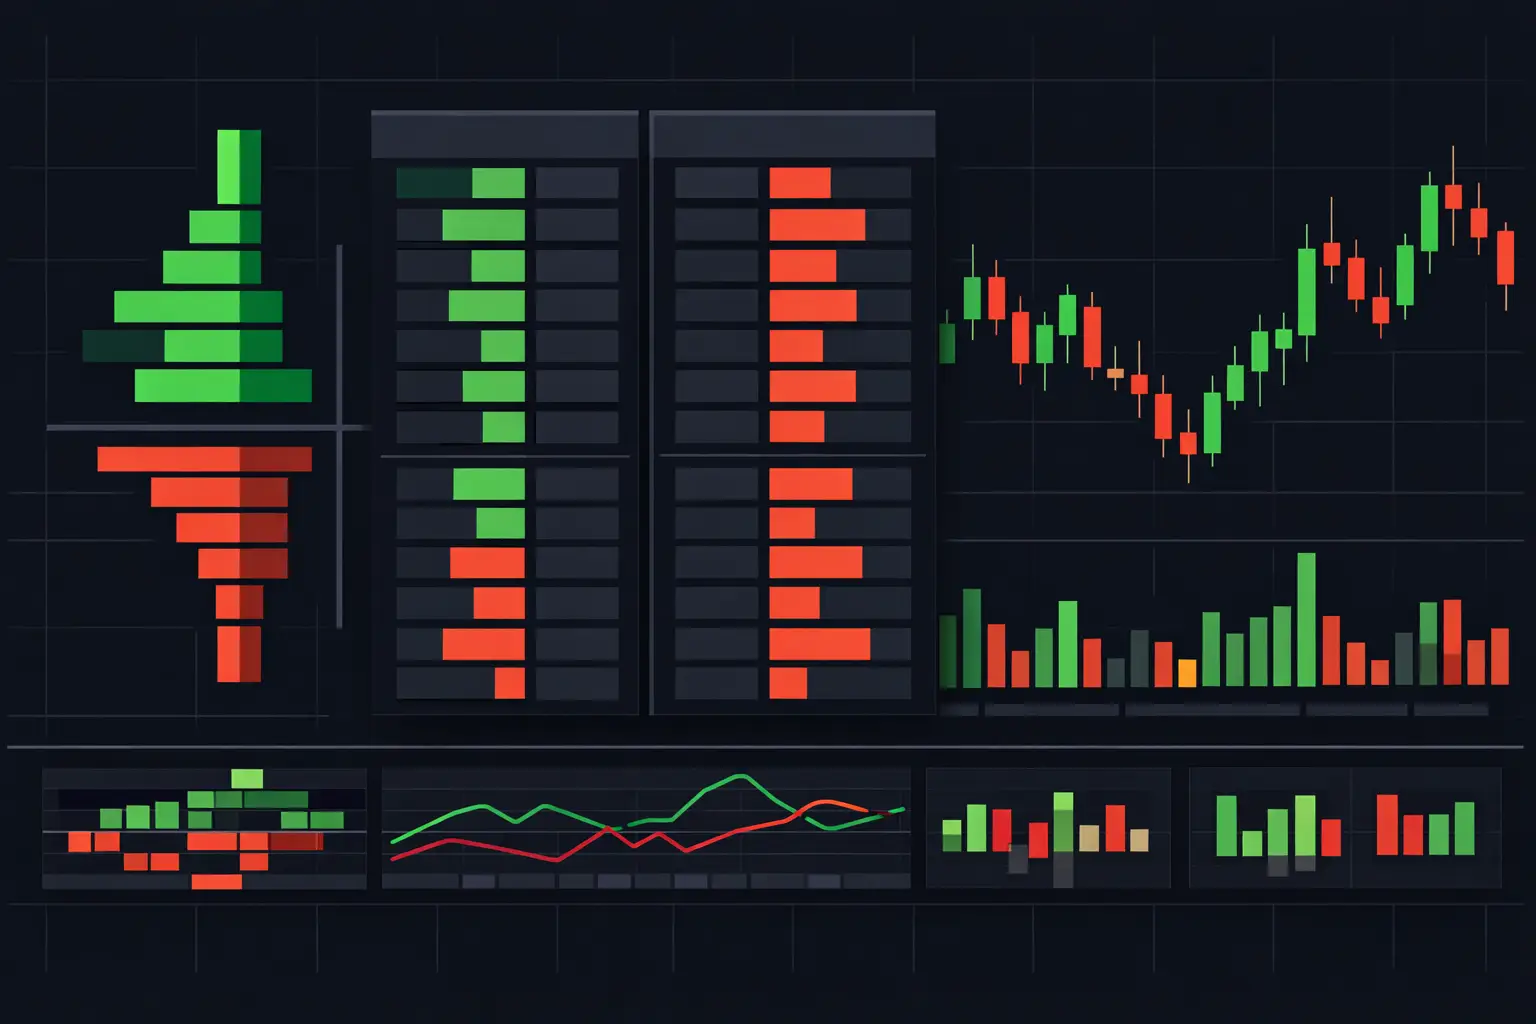
Most traders stare at candles and guess which side controlled the auction. A bid ask volume indicator NinjaTrader chart replaces that guesswork with the executed transactions inside every bar: volume traded at the bid, volume traded at the ask, delta, trade count, and the exact prices where participation concentrated. For active futures traders, that is the difference between seeing a bar close and seeing how the bar was built.
A conventional candle compresses a full auction into four values. It can show that the E-mini S&P 500 futures contract moved higher, but it cannot show whether buyers lifted offers through multiple price levels, whether selling was absorbed at the low, or whether a single price became the bar's volume point of control. Bid/ask data gives the chart its internal structure.
What a Bid Ask Volume Indicator Shows
Bid/ask volume classifies completed transactions by where they execute. Volume transacted at the ask represents aggressive buying: market participants accepted the offer available at that price. Volume transacted at the bid represents aggressive selling: participants accepted the bid.
That distinction matters because traded volume is not the same as resting liquidity. A large offer displayed in the market-by-order feed may be canceled, refreshed, or consumed. Bid/ask volume records what actually traded. It provides an execution-based record of aggression at each price level.
In a footprint display, each row corresponds to a price. The chart can print bid volume on one side and ask volume on the other, allowing the auction to be read vertically within the bar. Instead of treating a 10-point bar as one event, you can inspect where activity accelerated, where it stalled, and where one side repeatedly accepted prices.
Delta Is the First Layer, Not the Whole Read
Delta is ask volume minus bid volume. Positive delta indicates more volume executed at the ask than at the bid. Negative delta indicates the opposite. Cumulative delta extends that calculation across a defined period, showing how aggressive participation has developed through the session or another chosen range.
But delta is context, not a standalone verdict. A bar can close lower with positive delta when aggressive buyers are met by larger passive supply. It can close higher with negative delta when aggressive selling is absorbed and price refuses to auction lower. The relationship among delta, bar location, developing volume, and subsequent acceptance is where the useful information sits.
A capable bid ask volume indicator should let you display delta at the price level and at the bar level. That separation is useful during fast rotations. The bar may have a modest net delta while containing a concentrated burst of ask-side activity at its high or bid-side activity at its low.
Bid Ask Volume Indicator NinjaTrader Configuration
NinjaTrader 8 traders need more than a fixed bid-by-ask print. Different instruments, session structures, and chart compressions require different visual treatments. A footprint chart should preserve the data while allowing the operator to decide what deserves emphasis.
Start with the price aggregation. One tick per row provides the highest resolution and is often appropriate for liquid index futures when reading a narrow intraday auction. Combining multiple ticks per row reduces visual density and can make broader rotations easier to interpret. The trade-off is straightforward: aggregation improves readability but can conceal the exact price where initiative volume appeared.
Next, determine how bid and ask values are rendered. Text-based cells are efficient when you need exact numbers. Color gradients make relative participation visible immediately. Histogram-style cells can reveal concentration without forcing the eye to read every print. The strongest layout is not universally the most colorful one. It is the one that preserves recognition speed when bars begin developing quickly.
SidiFootprint provides independent control over footprint columns, color thresholds, volume filters, delta displays, profile columns, and price-level calculations. That depth matters because a chart built for a tight opening rotation should not have to look like a chart used to inspect a multi-hour balance area.
Use Diagonal Imbalances Correctly
Diagonal imbalance is one of the most useful bid/ask comparisons because it compares aggression across the auction rather than across the same row. At a given price, ask volume is compared with bid volume one tick below. For selling pressure, bid volume is compared with ask volume one tick above.
This structure aligns with how price moves. Buyers lifting the ask at one price are pushing into the next available offer above. Sellers hitting the bid are pushing into the next available bid below. When the ratio exceeds your chosen threshold, the chart can highlight the imbalance.
A single imbalance can be informative, but stacked imbalances carry more structural weight. Several consecutive ask-side imbalances can show sustained initiative buying through a range. Several consecutive bid-side imbalances can show sustained initiative selling. Their location still determines their meaning. A stack in the middle of an established balance is different from a stack that drives through a prior high and holds above it.
Avoid setting imbalance thresholds so low that nearly every active price level is highlighted. The display becomes noisy and the exceptional event disappears. Set a ratio and minimum volume threshold that fit the instrument's normal participation, then adjust them when volatility and session liquidity change.
Add Profile Context to the Footprint
Bid and ask prints are most useful when paired with volume-profile structure. A footprint tells you how the auction occurred inside a bar. A profile tells you where the market spent volume across a broader reference period.
The VPOC marks the price with the greatest traded volume in the selected profile. Value area boundaries frame the portion of volume distribution defined by the selected percentage. Developing VPOC and developing value area lines show how that distribution changes while the session is still forming.
This matters when aggressive activity reaches an established reference. Suppose high ask volume and positive delta appear as price tests a prior VPOC. The footprint shows the immediate execution. The profile shows why that price may matter to the auction. If volume begins building above that reference, the developing profile provides a different read than a quick test that returns into the prior distribution.
Dual independent profile columns are particularly useful when you need two time horizons visible at once. One column can show the current session's developing distribution while the other tracks a separate custom range. That removes the need to choose between local auction detail and larger structural context.
Identify Absorption and Exhaustion at the Price Level
Absorption occurs when aggressive volume repeatedly trades into passive liquidity but price makes limited progress. Heavy ask volume at a high with little upward extension can indicate that offers are absorbing buyers. Heavy bid volume at a low with little downward extension can indicate that bids are absorbing sellers.
The key is not merely high volume. High volume can accompany continuation, rotation, or a completed auction. Absorption is a relationship between executed aggression and constrained price movement. A footprint makes that relationship visible because the volume is tied to the exact price where it occurred.
Exhaustion is different. It often appears as a thinning of activity at the end of a directional auction, sometimes with a final burst at the extreme followed by an inability to continue. It depends on the bar structure, nearby liquidity, and whether the market accepts or rejects the extreme afterward. A chart should show the condition clearly without forcing a simplistic interpretation onto it.
Build a Layout for Fast Markets
A bid/ask display becomes less useful when the screen is crowded with duplicate information. Prioritize the elements you actively read: bid/ask cells, bar delta, diagonal imbalances, VPOC, and one or two profile references. Then use color deliberately. If every condition has a bright fill, no condition has priority.
Keep developing bars visible. Waiting for a bar to complete can hide the changing participation that matters during a fast auction. Real-time updates let you observe whether a level is accumulating ask volume, whether bid-side pressure is expanding, and whether the bar's delta is changing as price approaches a reference.
Performance is part of chart design. A footprint tool must calculate and render price-level information without lagging behind the tape. Historical processing, live updates, multiple profile columns, and highly customized visual rules all place demands on the platform. The chart should remain responsive when the market is not.
The practical value of bid/ask volume is not that it simplifies the auction. It makes the auction visible at the level where it actually happens: price by price, transaction by transaction, with enough context to distinguish activity from acceptance.
See it on your own chart.
Every Sidi tool is unlocked in the free 14-day demo. Install SidiFootprint in NinjaTrader 8 and load one of the finished color styles to start.
Start free 14-day demo → SidiFootprint features Browse color stylesRelated articles
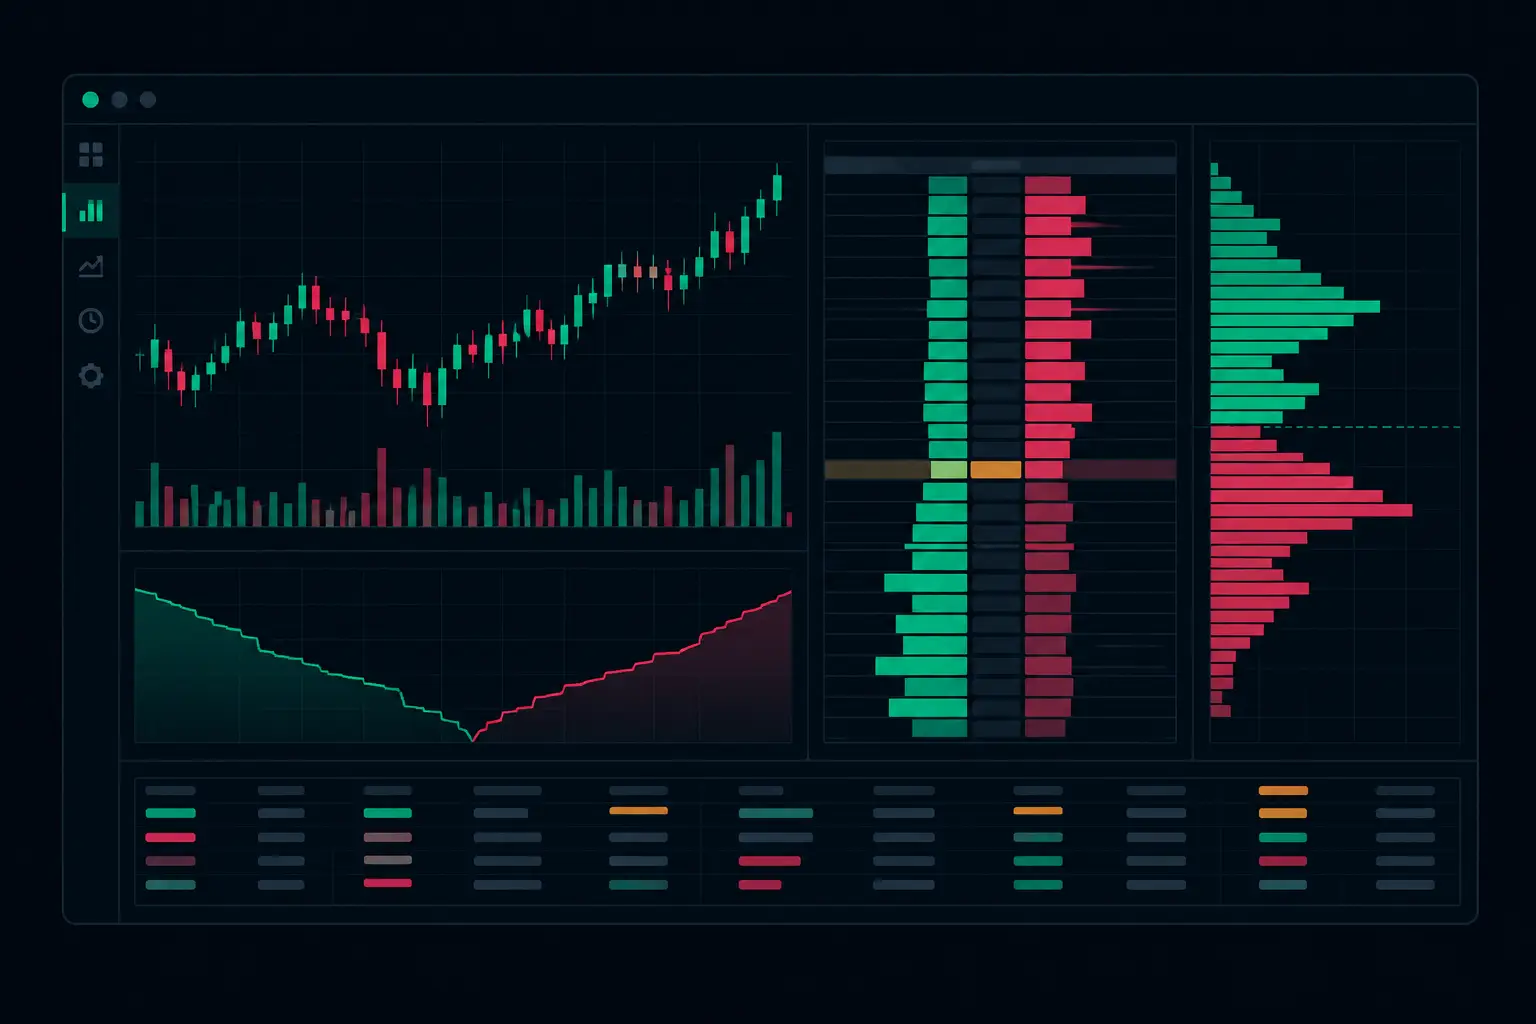
Futures Auction Analytics at Each Price Level
Futures auction analytics reveals the bid/ask interaction, delta, volume, and acceptance behind every developing futures auction in real time as it forms.
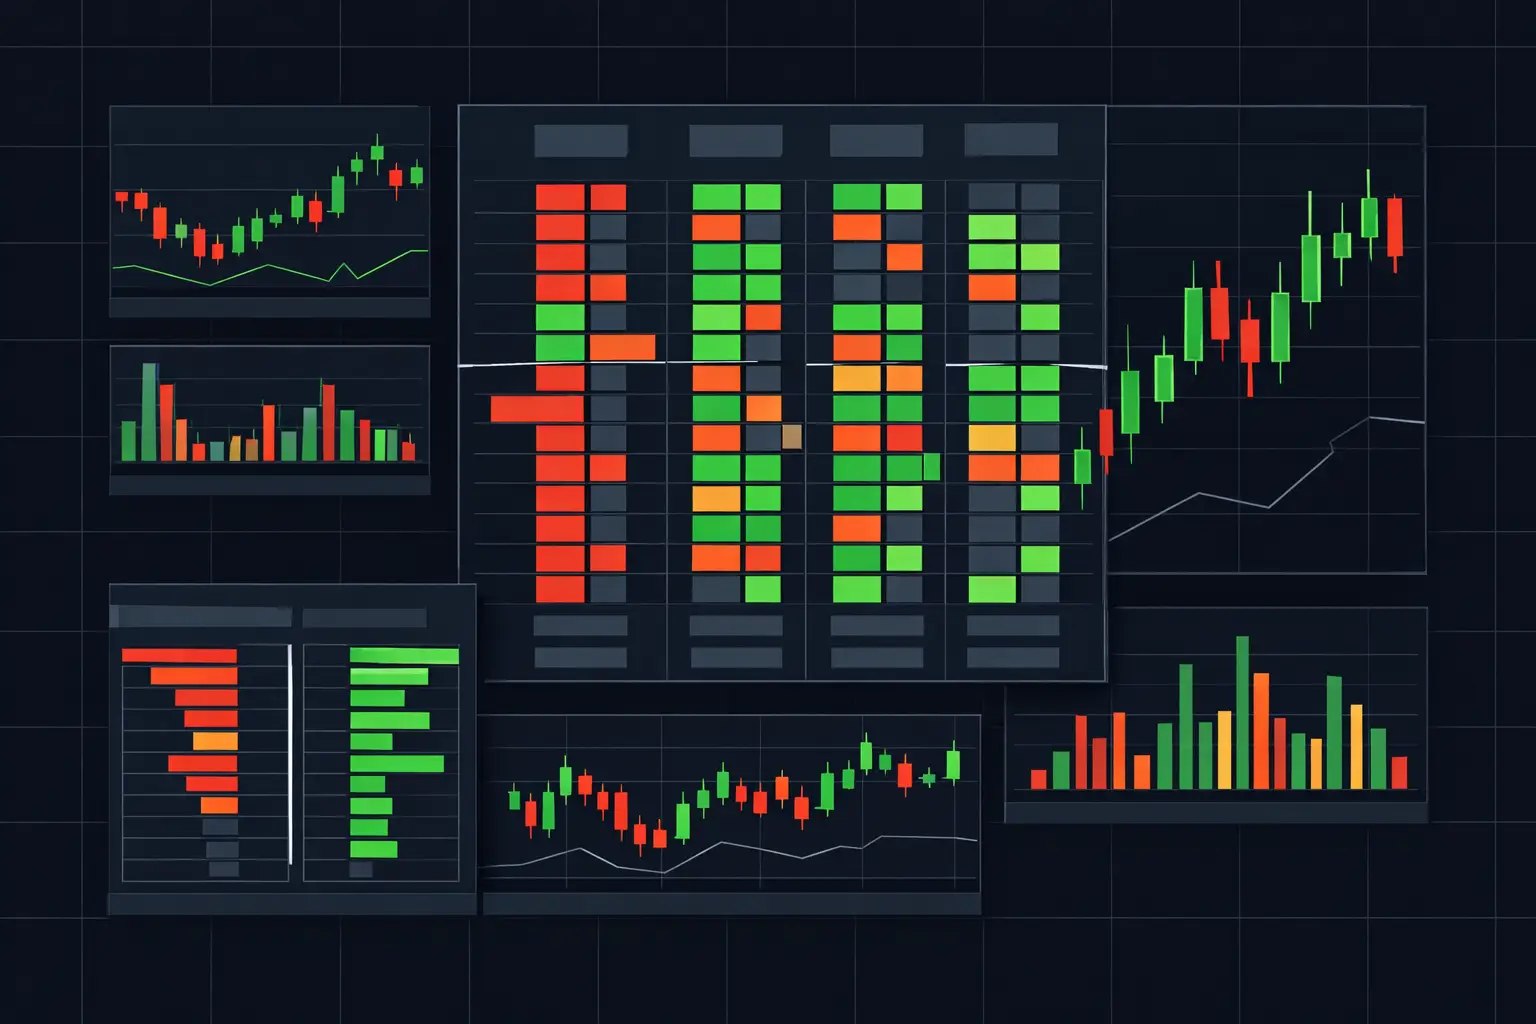
Footprint Chart Software for Faster Order Flow
Footprint chart software for NinjaTrader 8 shows bid/ask activity, delta, imbalances, profiles, and absorption at every traded price level in real time.
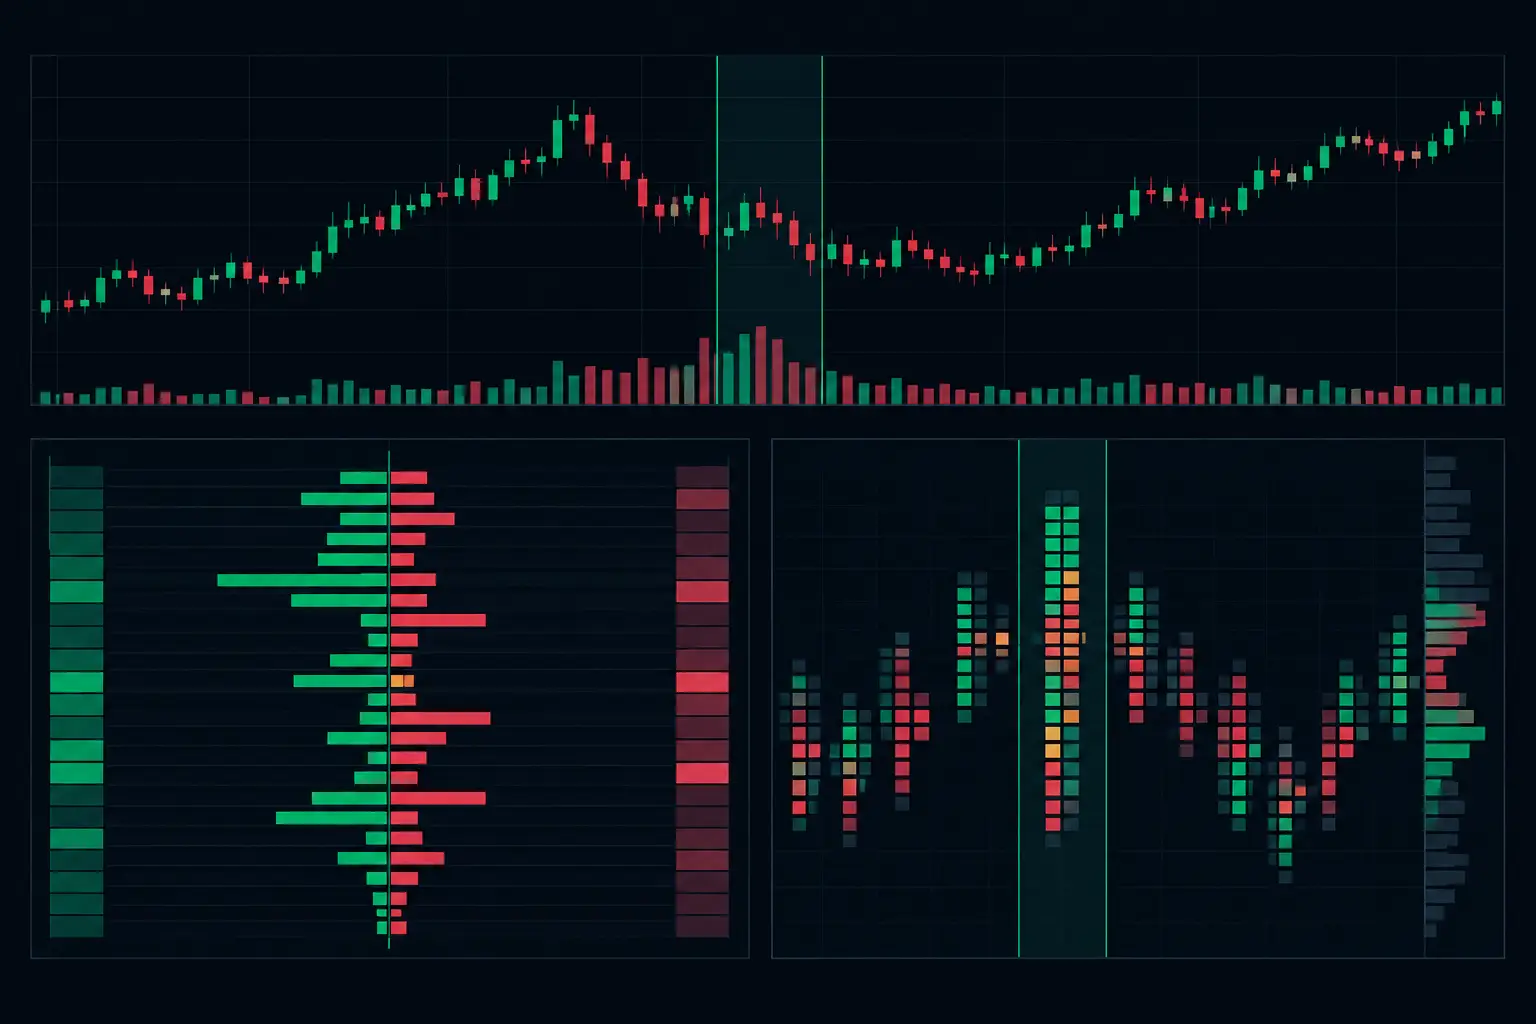
Bid Ask Delta Versus Volume on Footprints
Bid ask delta versus volume explains who traded aggressively, where participation concentrated, and how footprint context changes price-level analysis.