
Futures Auction Analytics at Each Price Level
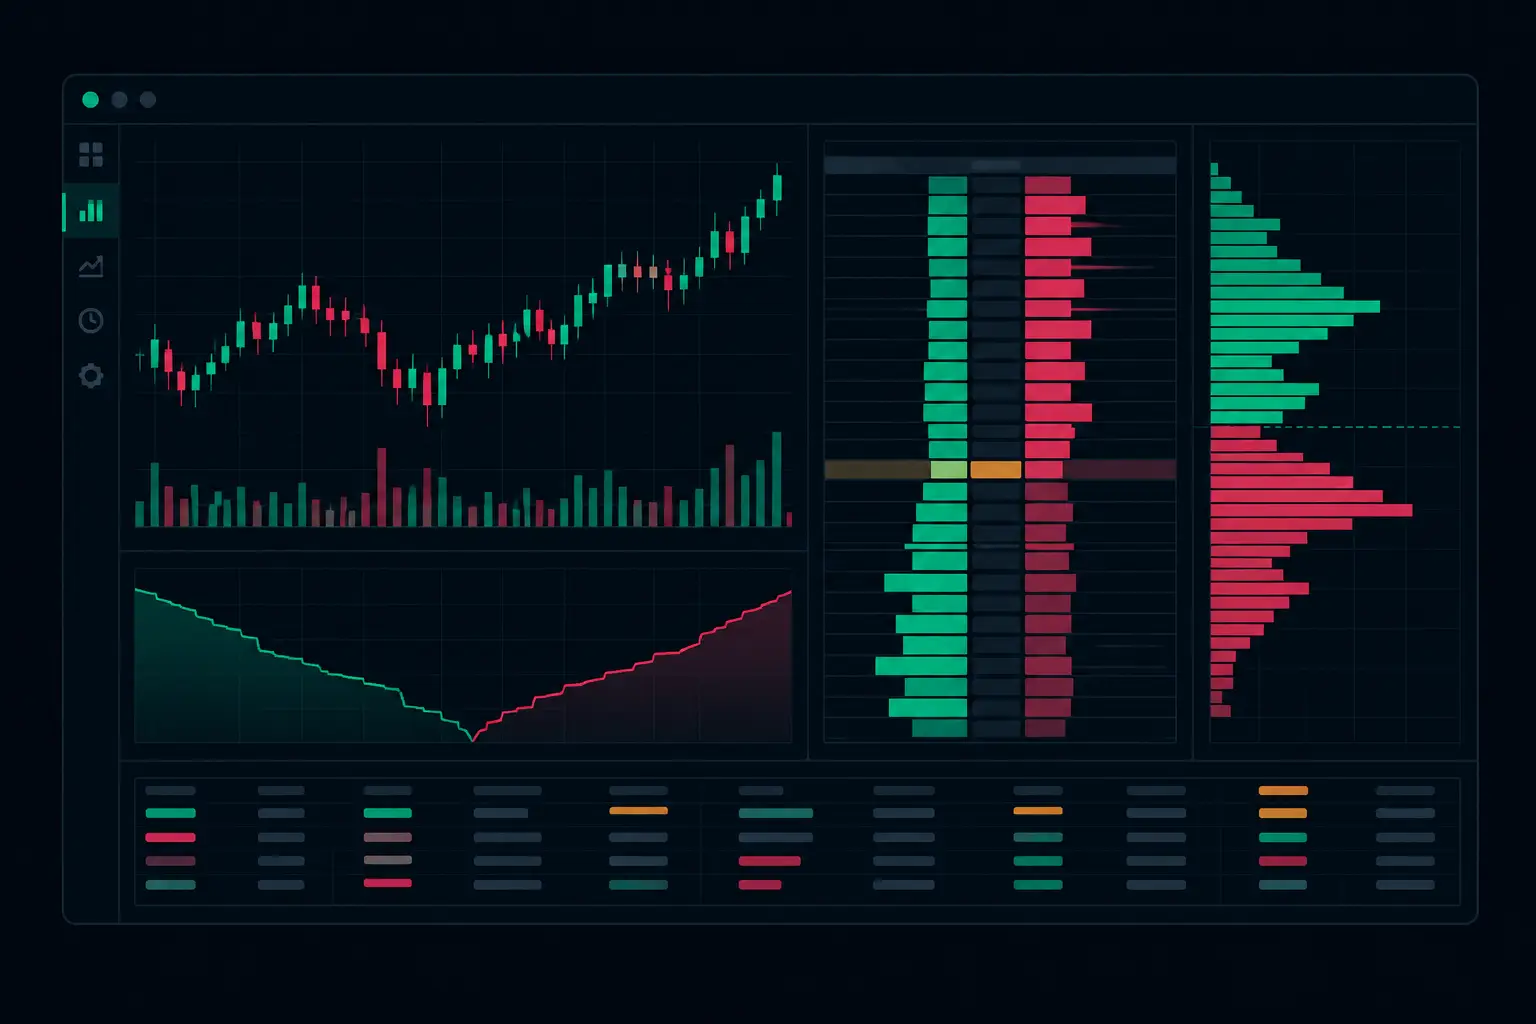
An ES bar can close green while aggressive selling repeatedly hits the bid at its upper prices. A conventional candle compresses that conflict into open, high, low, and close. Futures auction analytics keeps the auction intact: how much volume traded at each price, which side initiated it, where liquidity absorbed aggression, and whether the market accepted or rejected the area.
For active futures traders, that distinction is not cosmetic. The auction is a sequence of two-sided transactions occurring price by price. A footprint chart exposes the sequence inside the bar, allowing the chart to show participation rather than merely the resulting range.
What Futures Auction Analytics Actually Measures
At its core, futures auction analytics organizes bid/ask data around price. Every completed transaction is classified by whether it occurred at the bid or the ask. The footprint then displays those values at each price level, along with calculations such as delta, total volume, trades, imbalances, and session-level profile information.
Ask volume represents aggressive buyers lifting available offers. Bid volume represents aggressive sellers hitting available bids. Delta is the difference between the two. A positive delta at a price means more volume transacted at the ask; a negative delta means more transacted at the bid. Neither number has meaning in isolation. Its location within the developing bar, its relationship to prior prices, and the response that follows determine its context.
A large positive delta near a high can represent active lifting into an area where passive sellers are willing to transact heavily. If price cannot continue higher despite that activity, the relevant observation is not simply buying pressure. It is the mismatch between aggressive demand and limited price progress. The same logic applies at lows where heavy bid volume meets passive buying interest.
Aggression and Passive Liquidity Are Different Information
Footprints make aggressive participation visible. They do not directly display every resting order that did not transact. What they can reveal is the interaction between aggression and price response.
When repeated ask-side volume appears at one level and price remains contained, absorption may be present. When the auction moves quickly after liquidity at a level is consumed, the footprint can show the expansion through consecutive price levels. This is why volume, delta, and bar range need to be read together. A large number without response is different from a large number accompanied by immediate displacement.
Acceptance, Rejection, and Developing Value
An auction does not treat all prices equally. Some levels facilitate extensive two-way trade and become accepted. Others are tested briefly, transact lightly, and are abandoned. Futures auction analytics provides the detail needed to separate those conditions while the bar and session are still developing.
The volume point of control, or VPOC, identifies the price with the greatest traded volume in a defined profile. A developing VPOC that migrates through a session reflects where activity is concentrating. If volume continues to build around a narrow group of prices, the market is facilitating trade there. If the auction repeatedly extends away from that area and returns, the profile may be showing rotation around accepted value rather than sustained relocation.
Value area adds another layer. It frames the range containing a selected percentage of profile volume, commonly 70 percent. The exact percentage and profile boundaries are configuration choices, not fixed laws. A regular trading hours profile, an overnight profile, and a custom session profile can produce very different references because each includes a different auction.
At the edge of value, the footprint matters. A fast test beyond an area with thin volume, exhausted participation, and immediate return has a different structure from a test that builds volume and develops a new VPOC outside the prior range. The chart is not assigning intent. It is showing whether the auction found sustained two-way participation at the new prices.
Configure the Chart for the Auction You Trade
The strongest footprint layout is not the busiest one. It is the one that keeps the information required for a specific auction visible without forcing the eye to decode competing color rules during fast movement.
Start with the footprint calculation. Bid x ask is the direct format for comparing aggressive selling and buying at each price. Delta footprints emphasize the imbalance between the two sides. Volume footprints prioritize total activity. A trader focused on absorption may keep bid x ask visible, while someone tracking distribution across a session may give more chart space to a profile column. Both approaches can be valid when the visual hierarchy is intentional.
Imbalance settings deserve the same discipline. A diagonal imbalance compares ask volume at one price with bid volume one tick below, or bid volume with ask volume one tick above. This follows the actual path of aggressive participation through adjacent prices. The ratio threshold, minimum volume filter, and color treatment control how much activity is emphasized. Thresholds set too low color nearly every active area; thresholds set too high can hide meaningful sequences of participation.
Stacked imbalances should be configured as structure, not decoration. A single imbalance can occur in ordinary rotation. Several aligned imbalances across consecutive price levels show sustained initiative activity through an area. Their value comes from their position: near a session extreme, through a prior high-volume area, or during expansion away from a developing balance.
SidiFootprint is built for this level of control in NinjaTrader 8, with independent profile columns, configurable VPOC and value-area displays, imbalance logic, absorption and exhaustion detection, and more than 1,000 configuration options. The practical benefit is not adding every feature to one chart. It is arranging the data so the relevant auction condition remains readable when the tape accelerates.
Color Should Carry Meaning, Not Create Noise
Use a restrained color scheme with a defined job for each element. One color family can distinguish ask-side from bid-side activity; another can reserve emphasis for imbalances, maximum volume, or delta extremes. Keep ordinary prints legible and reserve the strongest contrast for conditions that deserve immediate attention.
Text size matters as much as color. A footprint that requires zooming during active periods has failed its purpose. Set the font, row height, and bar spacing for the instrument's normal intraday tempo, then test the layout during high-volume periods. The goal is rapid recognition of auction structure, not maximum density.
Connect the Bar to the Session Profile
A footprint bar is local information. A session profile supplies the larger auction map. Reading one without the other creates blind spots.
Consider a high-volume node in a session profile. It marks a price area where substantial trade occurred, but it does not explain how the market approached or left that area. Footprints answer that question. Did the area form through balanced two-way trade? Did aggressive buying repeatedly meet absorption? Did delta expand while the range remained constrained? The profile identifies where participation concentrated; the footprint reveals the mechanics within and around that concentration.
Low-volume areas require similar care. They can mark fast travel between accepted regions, but not every revisit produces the same behavior. A return that quickly builds two-way volume changes the profile's structure. A return that remains thin and passes through rapidly preserves a different type of auction. Developing profiles are essential here because a static end-of-session profile hides the order in which value formed.
Dual profile columns can be especially useful when comparing separate auction windows, such as overnight activity beside regular trading hours. Keeping their VPOCs and value areas independent prevents one period's volume from obscuring the other period's structure.
A Disciplined Read of the Developing Auction
Start with location. Identify whether the current bar is operating within an established high-volume region, at value-area boundaries, around a prior extreme, or in a low-volume path. Then read participation at the price levels that matter, not every number in the bar.
Next, compare aggression with response. Heavy ask volume that cannot extend price communicates something different from heavy ask volume that continues through several levels. Watch whether delta is concentrated at one price or distributed through the range. Concentrated activity often highlights a specific liquidity interaction; distributed activity can describe broader initiative participation.
Then track developing references. Is the bar VPOC shifting? Is the session VPOC remaining stable while price rotates away? Are value boundaries expanding as volume builds, or is the auction testing outside value without establishing activity? These references organize the footprint details into an auction narrative.
Finally, preserve the distinction between observation and assumption. A footprint records executed transactions and calculated relationships. It cannot reveal every resting order or assign a motive to each participant. Treat absorption, exhaustion, and imbalance as visible market conditions that require context from location, response, and developing profile structure.
Where Footprint Reading Commonly Breaks Down
The most common error is treating positive delta as automatically bullish or negative delta as automatically bearish. Delta describes who crossed the spread. It does not, by itself, describe whether price accepted those transactions. A bar can show intense ask-side activity and still fail to advance because passive liquidity absorbed it.
Another error is using fixed imbalance thresholds across every instrument and session. Contract behavior changes with volatility, time of day, and participation. A threshold that isolates meaningful activity in ES during a quiet period may be too sensitive during a fast open. Review the density of highlighted prints and adjust the filter to maintain contrast.
Finally, avoid freezing the chart at completed-bar logic. The auction develops continuously. A developing VPOC, shifting delta, and newly formed stacked imbalance can change the visual structure before the bar closes. Real-time analytics is most useful when the chart layout makes those changes obvious without burying them under unnecessary studies.
The edge in futures auction analytics is not a single colored cell. It is the ability to see exactly where participation concentrates, where it fails to move price, and where the auction begins to build new value.
See it on your own chart.
Every Sidi tool is unlocked in the free 14-day demo. Install SidiFootprint in NinjaTrader 8 and load one of the finished color styles to start.
Start free 14-day demo → SidiFootprint features Browse color stylesRelated articles
Footprint Chart Software for Faster Order Flow
Footprint chart software for NinjaTrader 8 shows bid/ask activity, delta, imbalances, profiles, and absorption at every traded price level in real time.
Bid Ask Volume Indicator NinjaTrader Explained
Use a bid ask volume indicator NinjaTrader chart to expose volume, delta, imbalances, absorption, and profile context at every price level across futures.
Diagonal Imbalance Footprint Chart Explained
A diagonal imbalance footprint chart exposes aggressive bid and ask activity price by price, giving futures traders precise auction context in real time.