
Bid Ask Delta Versus Volume on Footprints
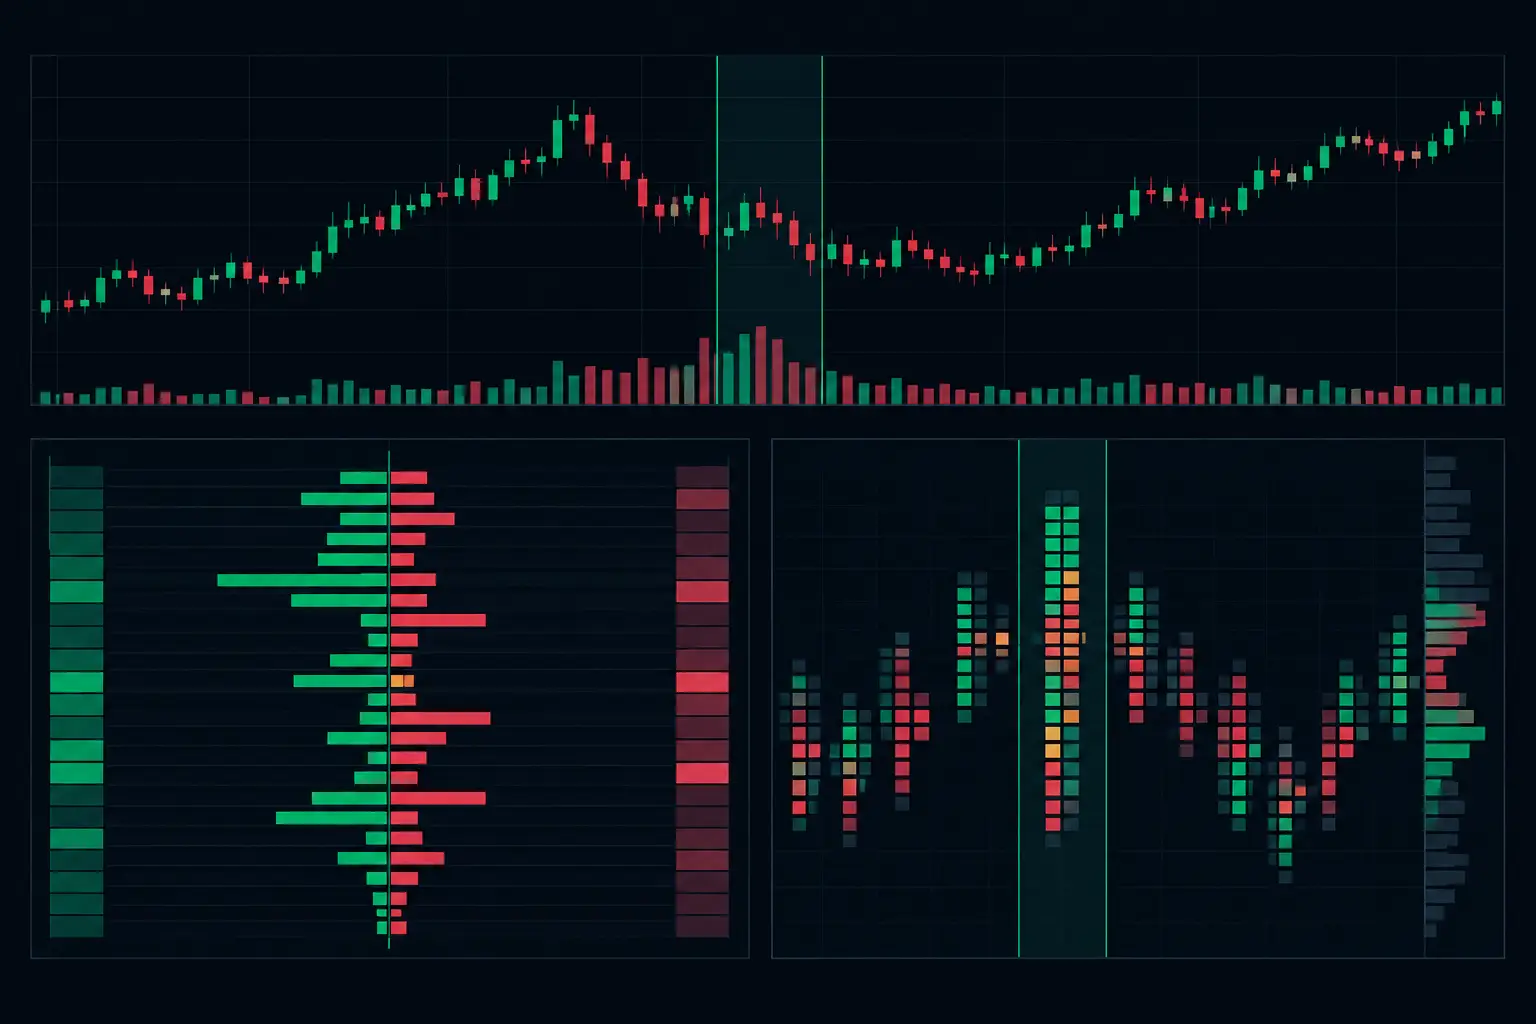
A 20,000-contract bar can look decisive on a standard volume study and reveal almost nothing about who initiated the activity. Bid ask delta versus volume separates that ambiguity. Volume tells you how much traded. Delta shows whether market participants were more aggressive at the ask or at the bid. On a footprint, that distinction exists at every price level rather than being compressed into one bar total.
Most traders stare at candles and guess whether a fast move was driven by aggressive lifting, aggressive hitting, passive absorption, or two-way rotation. A footprint chart exposes the auction mechanics. It shows what actually traded at each price, then lets you organize that information around developing structure, VPOC, imbalances, and session context.
Bid Ask Delta Versus Volume: The Core Difference
Volume is the total number of contracts exchanged. It does not care which side initiated the transaction. If 500 contracts trade at the ask and 500 trade at the bid, total volume is 1,000 contracts. The bar may show substantial participation, but its delta is zero.
Bid/ask delta is calculated as ask volume minus bid volume. Ask volume represents contracts executed against the offer by aggressive buyers. Bid volume represents contracts executed against the bid by aggressive sellers. Using the same example, 500 ask volume minus 500 bid volume produces zero delta.
That is why high volume and high delta are not interchangeable. A bar can carry high volume with near-zero delta during active two-way auction. It can also print moderate volume with strongly positive or negative delta when one side consistently initiates at the market. Neither reading is complete without location and structure.
At the price level, the calculation is even more useful. A footprint might show 340 x 1,120, meaning 340 contracts traded at the bid and 1,120 traded at the ask. The total volume at that price is 1,460. Delta is +780. Volume describes the size of the exchange; delta describes the directional imbalance in aggressive execution.
Why Total Volume Can Hide the Auction
Total volume is essential for locating participation. VPOC, high-volume nodes, low-volume areas, and developing profiles all depend on it. But volume alone cannot distinguish a balanced exchange from one-sided market-order pressure.
Consider two price levels, each with 2,000 contracts traded. At the first level, 1,000 contracts execute at bid and 1,000 at ask. At the second, 300 execute at bid and 1,700 at ask. Their volume is identical. Their delta is not. The first is balanced rotation. The second shows concentrated lifting of offers.
This difference becomes critical when price does not respond as expected. Heavy ask volume and positive delta near a prior high may appear forceful, yet price can stall if passive sellers continue replenishing the offer. That is absorption: aggressive participation is visible, but the resting liquidity absorbs it. The volume is real. The positive delta is real. The inability to extend is part of the read.
The inverse applies at lows. Large bid volume and negative delta can accompany aggressive selling into a passive buyer. If price stops progressing lower while negative delta continues printing, the footprint provides a clearer view of that conflict than a candle or bar-volume histogram.
Read Delta in Context, Not in Isolation
A positive delta is not automatically bullish structure, and negative delta is not automatically bearish structure. Delta measures aggressive execution, not the full resting-liquidity book. A meaningful reading requires location, response, and sequence.
Location comes first. Positive delta at the center of a balanced session has a different character than positive delta at an excess high, a prior VPOC, or the edge of a developing value area. The same is true for negative delta near session lows, low-volume zones, and prior support or resistance references.
Response comes next. Did price continue through the level, rotate away immediately, or spend time building volume there? A footprint makes this visible bar by bar and price by price. When aggression produces clean progression, the auction is accepting higher or lower prices. When aggression repeatedly fails to move price, passive participation may be controlling that level.
Sequence prevents single-print analysis from becoming noise. One large positive delta bar can be an isolated burst. Multiple bars with expanding positive delta, stacked ask imbalances, and a migrating VPOC show a more developed condition. Likewise, repeated negative delta at successive prices can show sustained hitting of bids, while an exhaustion print may appear as a late, extreme burst that fails to produce further extension.
Delta, Cumulative Delta, and Footprint Detail
Bar delta is a snapshot. Cumulative delta adds each bar's delta over a selected session or reset period, making persistent aggressive participation easier to track. It is useful for seeing whether the auction is repeatedly favoring market buyers or sellers even when individual bars alternate.
Cumulative delta still needs price-level confirmation. A rising cumulative delta alongside upward price acceptance is different from rising cumulative delta while price remains capped beneath the same level. In the second case, the footprint can show whether buyers are lifting into absorption or whether volume is building before a later repricing.
The footprint is where the broad measure becomes operational. Instead of seeing only a +2,400 delta bar, you can see where that delta formed. Was it concentrated at the high? Distributed across the bar? Did the bar contain stacked diagonal ask imbalances? Did the largest volume print at the top, middle, or low? These details determine whether a large delta total represents organized initiative activity or a late burst into opposing liquidity.
Diagonal Imbalances Add Relative Pressure
Diagonal imbalance compares ask volume at one price with bid volume one tick below, or bid volume with ask volume one tick above. This reflects how buyers lift through offers or sellers hit through bids as the auction moves from one price to the next.
For example, if ask volume at 5,250.00 is 600 and bid volume at 5,249.75 is 100, the ask side is six times larger. With a configured ratio threshold, that can be marked as an ask imbalance. Several aligned imbalances create a stacked imbalance, showing concentrated aggression across consecutive prices.
The threshold matters. A low ratio identifies more events but can clutter active instruments. A higher ratio isolates stronger disparities but may omit useful developing activity. Minimum-volume filters are equally important because a 10 x 60 relationship is mathematically large but structurally different from a 500 x 3,000 relationship.
Configure the Chart for the Question You Are Asking
No single footprint layout is optimal for every auction condition. If the goal is to study participation at exact prices, display bid x ask volume with per-row delta and a clearly defined color scale. If the focus is bar-level pressure, add delta totals, cumulative delta, and bar statistics while keeping the ladder readable during fast movement.
Color should encode magnitude without hiding text. A fixed scale can make sessions comparable, while an adaptive scale highlights relative extremes inside the current session. Neither is universally superior. Fixed thresholds preserve consistency; adaptive thresholds react better when participation changes sharply between quiet and fast periods.
Profile columns add another layer of context. A volume profile identifies where the session has conducted business. A delta profile identifies where aggressive activity concentrated. Running both independently prevents a common mistake: assuming the highest-volume area was also dominated by one aggressive side. Often it was not.
In SidiFootprint, separate profile columns, price-level statistics, developing VPOC, value areas, imbalance logic, and absorption or exhaustion displays can be arranged around the same bar structure. The advantage is not more decoration. It is keeping volume, delta, and response visible in one execution-grade workspace instead of reconstructing the auction from disconnected studies.
Practical Reads That Separate Volume From Delta
High volume at a developing VPOC with contained delta often indicates active two-way trade. The market is doing business at that price, but neither aggressive side is clearly controlling the interaction. Watch whether the VPOC remains stable, migrates, or is left behind as price explores away from value.
High positive delta at a session high requires a response check. If offers are lifted and price holds above the level, the footprint shows acceptance. If large ask prints accumulate but price cannot extend, sellers may be absorbing the initiative activity. The same logic applies to heavy negative delta at session lows.
Low volume with sharp delta can occur in thin areas. The delta may look extreme because little traded on the opposite side, yet the total participation is limited. This is why absolute volume filters and relative imbalance ratios should work together. A large ratio without meaningful size is not equivalent to broad participation.
Delta divergence is another context tool. Price can make a new extreme while cumulative delta does not confirm the same expansion, or cumulative delta can push to a new extreme while price remains contained. Divergence is not a standalone conclusion. It is a prompt to inspect the footprint for absorption, exhaustion, trapped aggression, and the exact price levels where the auction changed character.
When the tape accelerates, reduce the question to its essentials: how much traded, who initiated it, where it traded, and whether price accepted or rejected that activity. Volume supplies the first answer. Bid/ask delta supplies the second. The footprint keeps the remaining two visible where they matter most: at the price level.
See it on your own chart.
Every Sidi tool is unlocked in the free 14-day demo. Install SidiFootprint in NinjaTrader 8 and load one of the finished color styles to start.
Start free 14-day demo → SidiFootprint features Browse color stylesRelated articles
Footprint Chart Software for Faster Order Flow
Footprint chart software for NinjaTrader 8 shows bid/ask activity, delta, imbalances, profiles, and absorption at every traded price level in real time.
Bid Ask Volume Indicator NinjaTrader Explained
Use a bid ask volume indicator NinjaTrader chart to expose volume, delta, imbalances, absorption, and profile context at every price level across futures.
E-mini Bid Ask Visualization That Holds Up
See E-mini bid ask visualization at each price level, with footprint, delta, imbalances, VPOC, and profiles built for fast NinjaTrader 8 charts in motion.