
E-mini Bid Ask Visualization That Holds Up
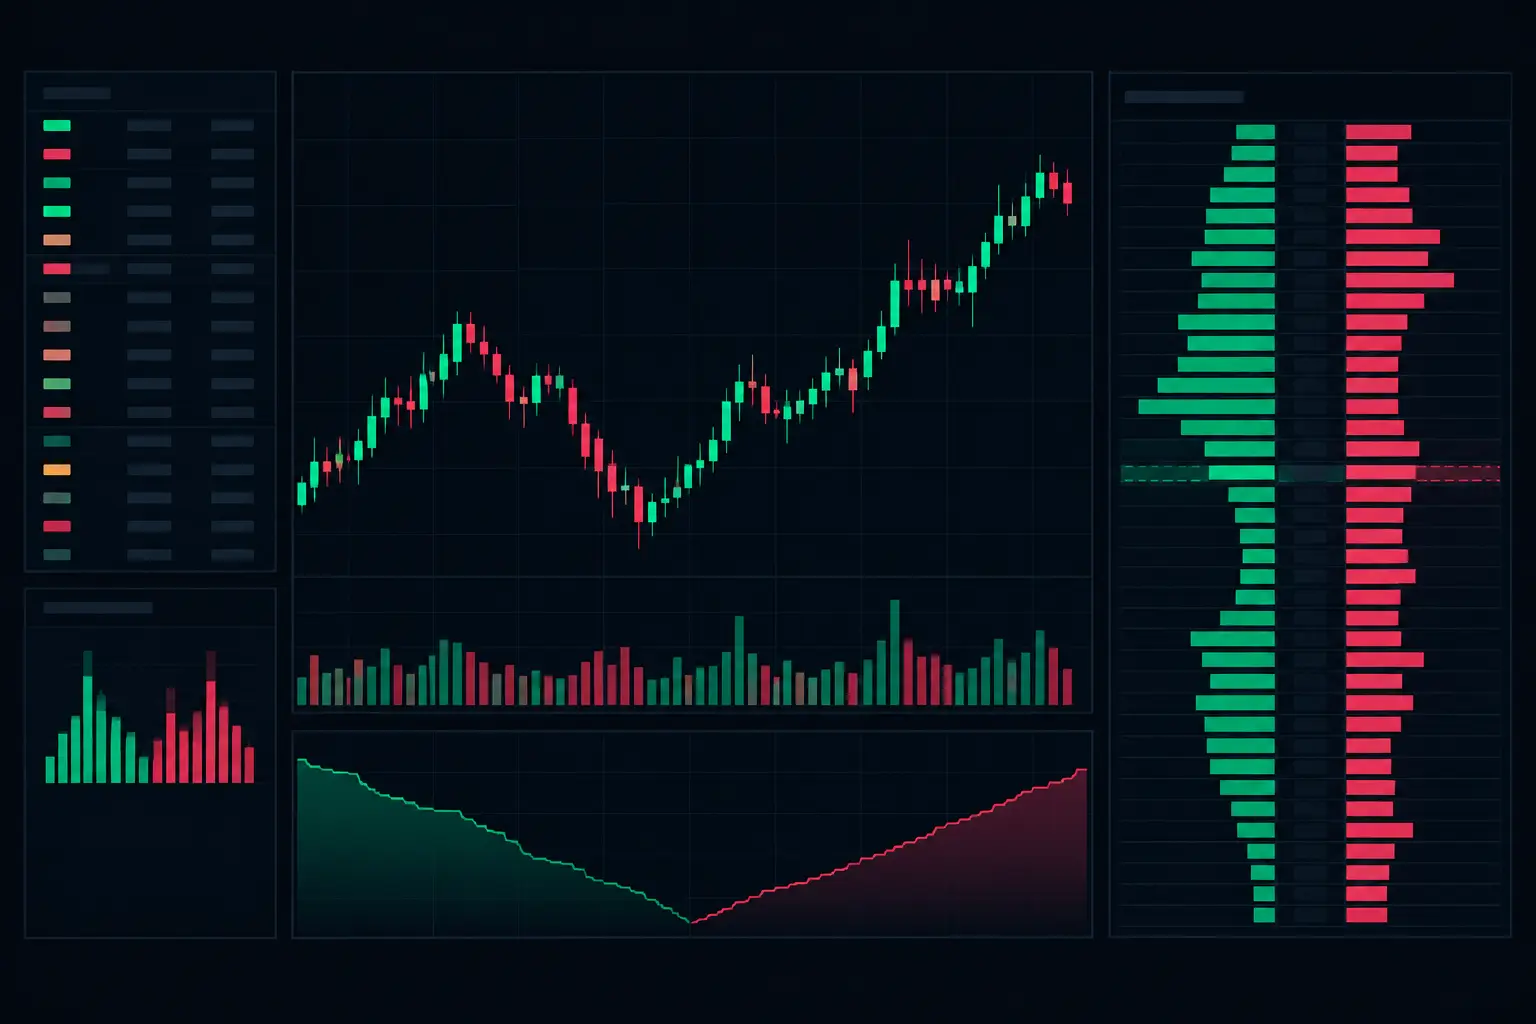
The E-mini bid ask visualization on your chart should answer a precise question: who actually lifted offers, who hit bids, and where did that aggression fail to move price? A conventional candle compresses that auction into four numbers. A footprint exposes the transaction sequence by price, so developing participation is visible while the bar is still forming.
For active E-mini S&P 500 futures traders, this distinction is operational. The ES can rotate through several handles while a candle remains visually ordinary. Inside that same candle, bid/ask volume may show one-sided initiative activity, repeated absorption at a known level, or a sharp shift in delta that candles do not display. The value is not more color on a chart. It is a structured view of what traded at every price level.
What E-mini Bid Ask Visualization Must Show
A useful footprint begins with two independent volume values at each price. Bid volume represents contracts executed against the resting bid. Ask volume represents contracts executed against the resting ask. Displaying those values side by side turns each price row into a record of aggressive participation.
That distinction matters because total volume alone can hide the character of the auction. A high-volume price can contain balanced two-way exchange, aggressive buyers lifting offers, aggressive sellers striking bids, or a sequence of both. Bid/ask columns preserve the difference.
The chart also needs to retain context around those prints. Delta, the difference between ask volume and bid volume, shows whether a price or bar carried net aggressive buying or selling. Bar delta is useful, but price-level delta is often more revealing. It identifies the exact rows where participation became concentrated rather than treating an entire bar as a single event.
An execution-grade visualization should let you choose the information density. During fast ES rotations, large text, clean contrast, and selective highlights can be more useful than a fully populated grid. During slower auction development, traders may prefer bid x ask, total volume, delta, trade count, VPOC, and profile columns visible together. The correct layout depends on bar type, screen space, and the specific auction behavior being examined.
Build the Footprint Around the Auction
The first configuration decision is not cosmetic: it is the footprint calculation and bar construction. A one-tick footprint provides maximum granularity, but it can become visually dense during active periods. Grouping prices by multiple ticks reduces row count and clarifies broader participation, while also combining activity that occurred at distinct prices. Neither setting is universally better.
For ES, one-tick rows are often appropriate when examining local absorption, diagonal imbalances, or a narrow rotation around a reference level. A larger aggregation can be more practical when viewing a wider range or when the objective is to read the shape of volume distribution rather than every transaction row.
Next, define the primary cell display. Bid x ask is the direct order-flow view. It allows the eye to compare aggression on both sides without relying on a derived value. Delta-only cells reduce clutter and make directional extremes immediate, but they remove the underlying volume relationship. Total volume can identify acceptance and high-activity nodes, yet it should not replace bid/ask information when the purpose is to distinguish initiative from response.
A strong workspace commonly uses more than one view. One footprint may prioritize bid x ask and diagonal imbalance highlighting. Another may use delta and a session profile to monitor the developing auction. The point is not to duplicate data. It is to keep each chart responsible for a specific layer of market structure.
Diagonal Imbalances: Compare the Correct Prices
Diagonal imbalance logic is one of the most effective ways to visualize aggressive participation because it compares activity across the spread rather than within the same row. Ask volume at one price is compared with bid volume one tick below. Bid volume at one price is compared with ask volume one tick above.
For example, if 420 contracts trade at the ask at 5,250.25 and 60 contracts trade at the bid at 5,250.00, the upper row shows a strong ask-side diagonal imbalance. That calculation reflects buyers lifting the offer relative to sellers active at the adjacent lower price. The inverse calculation identifies bid-side pressure.
The ratio threshold determines what receives emphasis. A low threshold produces frequent highlights and can overwhelm the footprint. A high threshold isolates exceptional activity but may omit meaningful participation in quieter conditions. Minimum volume filters are equally important. A 4:1 ratio based on very small prints carries less structural weight than the same ratio with substantial volume.
Stacked imbalances deserve separate treatment. Multiple adjacent imbalances on the same side show sustained aggression through a price sequence, not a single isolated row. Their location matters more than their color. A stacked ask imbalance into prior structure, a session high, or a developing value edge has different context than the same pattern in the center of a balanced rotation.
Read Absorption Without Confusing It With Delta
Positive delta does not automatically mean price should continue higher, and negative delta does not automatically mean price should continue lower. The footprint is most valuable when aggression and price response disagree.
Consider repeated ask-side volume at a local high. If buyers continue lifting offers while price cannot extend beyond a narrow range, passive sellers may be absorbing that activity. The chart should make this visible through bid/ask cells, delta coloration, volume concentration, and the absence of upward progress. The same principle applies at lows when repeated selling into bids fails to extend the auction.
Absorption is not one number. It is a relationship between aggressive volume, location, elapsed activity, and resulting price movement. A visualization that shows only bar delta forces the trader to infer too much. One that shows price-level activity alongside developing bars makes the relationship inspectable.
Exhaustion is different. Here, participation thins as an auction reaches an extreme. Small or fading prints near a high or low can indicate that the prior aggressive sequence is no longer being sustained. Exhaustion becomes more useful when viewed with nearby volume distribution and prior auction references. It should not be reduced to a single colored cell.
Add Profile Context Without Leaving the Chart
Bid/ask footprints explain the transaction detail. Profiles explain where that detail sits within the session auction. Without profile context, a large delta print may look important simply because it is large. With a profile, you can see whether it occurred at the VPOC, near a value-area boundary, at a low-volume area, or in an area where the session is extending.
A developing VPOC identifies the price with the greatest accumulated volume in the active profile. Its migration is often more informative than a static end-of-session marker. When the VPOC remains stable while price rotates around it, the session is organizing around acceptance. When it relocates through the range, participation is building elsewhere.
Dual independent profile columns are especially useful when session structure and local bar structure need to remain visible at the same time. One column can show total volume distribution while another displays bid/ask or delta distribution. This separates acceptance from aggression instead of forcing both ideas into a single histogram.
Value area settings also require discipline. A broad value area can clarify the session's accepted range but may obscure narrow intraday rotations. A shorter profile interval can reveal local structure but adds more visual objects to manage. The aim is not maximum data. It is a chart where each profile answers a distinct structural question.
Configure Color for Recognition, Not Decoration
Color should create instant recognition under speed. Ask-side dominance, bid-side dominance, delta extremes, imbalance rows, VPOC, value-area boundaries, and absorption conditions must remain distinguishable from one another. If every threshold uses a bright color, nothing is prioritized.
Use graduated color thresholds for volume and delta so ordinary activity remains quiet while exceptional prints stand out. Keep positive and negative delta colors consistent across footprints, profiles, and summary displays. Reserve the strongest contrast for conditions requiring immediate visual attention, such as stacked imbalances or a defined absorption threshold.
Text color and background color should be controlled independently. Large values can remain readable against strong heat-map backgrounds only when contrast is explicit. This is particularly relevant on high-resolution displays where compact footprint cells are common.
SidiFootprint supports deep control over these elements, including footprint cells, imbalance logic, profile columns, VPOC treatment, developing-bar behavior, alerts, and text-to-speech. That degree of configuration matters because a scalper reading one-tick interaction and a trader mapping session acceptance should not be forced into the same visual model.
Keep the Chart Usable When ES Accelerates
The most detailed E-mini bid ask visualization is useless if it lags, repaints its emphasis too late, or becomes unreadable when volume expands. Real-time performance and layout restraint are part of the analysis, not separate engineering concerns.
Start with the few visual layers you actively reference: bid x ask, diagonal imbalances, bar delta, a developing VPOC, and one relevant profile. Add absorption or exhaustion detection only when its styling remains distinct. Then test the chart during the pace where it normally becomes difficult to read. If you cannot identify the active auction in one glance, reduce competing emphasis before adding another study.
The objective is a chart that preserves transaction detail without turning the ES order flow into a wall of numbers. When every price row has a purpose, the developing auction becomes visible before the candle has finished telling its simplified version.
See it on your own chart.
Every Sidi tool is unlocked in the free 14-day demo. Install SidiFootprint in NinjaTrader 8 and load one of the finished color styles to start.
Start free 14-day demo → SidiFootprint features Browse color stylesRelated articles
Futures Order Flow Visualization Guide for E-mini
Use this futures order flow visualization guide to configure footprint, delta, VPOC, profiles, and imbalance context for fast E-mini auctions each day.
Footprint Chart Software for Faster Order Flow
Footprint chart software for NinjaTrader 8 shows bid/ask activity, delta, imbalances, profiles, and absorption at every traded price level in real time.
Bid Ask Delta Versus Volume on Footprints
Bid ask delta versus volume explains who traded aggressively, where participation concentrated, and how footprint context changes price-level analysis.