
Futures Footprint Interpretation Guide for Traders
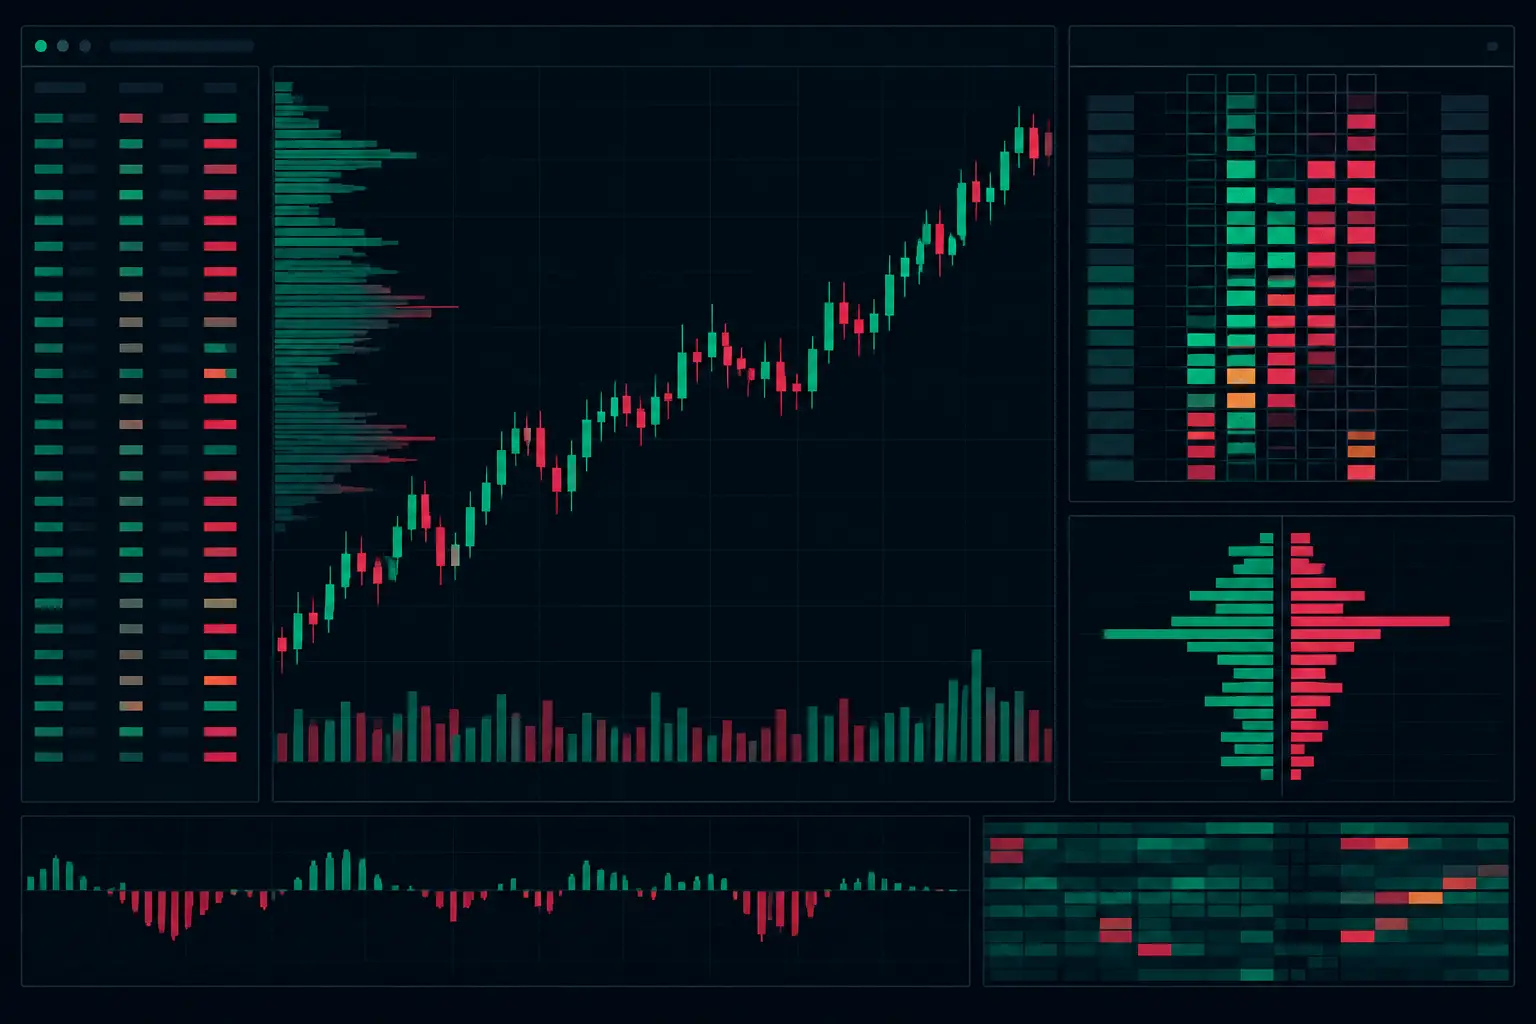
A footprint chart is not a colored replacement for a candle. It is an auction record: the volume executed at bid and ask at every price, the delta created by that interaction, and the location where participation concentrated. This futures footprint interpretation guide is built for reading that record in sequence, without reducing a developing auction to one highlighted cell.
Most traders stare at candles and guess at participation. A footprint exposes what actually traded at each price. The edge is not a single number. It is the relationship between aggressive activity, passive response, location within the session structure, and what price does next.
Start With the Auction, Not the Cell
A large ask print can mean aggressive buyers lifted offers. It does not, by itself, establish control. If that activity occurs into a prior high, a session high, or a prominent volume node and price cannot continue upward, the more relevant event may be passive selling absorbing the aggression.
Interpret every footprint event through four questions: Where is it occurring? Who initiated the transaction? Did price extend or stall after the transaction? How does the event compare with the developing profile and nearby bars? This order prevents a familiar mistake: treating volume as directional context before checking its location.
On an E-mini S&P 500 futures chart, the same positive delta has a different meaning at the lower edge of value than it has after a prolonged drive into an upper distribution. Context comes first. The print explains the mechanism inside that context.
Read Price Acceptance Before Aggression
Acceptance is visible when trading builds and remains active at a price area. Several bars may rotate through a zone, develop volume there, and establish a VPOC nearby. Rejection is different: price reaches an area, activity may expand sharply, but the auction quickly relocates away from it.
Do not confuse a fast move with acceptance. A fast move can be a thin traversal through low-volume prices. The footprint tells you whether that traversal attracted continued two-sided business or simply passed through an area where little volume was available.
Read Bid, Ask, and Delta in Their Proper Roles
At each price, bid volume represents contracts executed against resting bids; ask volume represents contracts executed against resting offers. Delta is ask volume minus bid volume. Positive delta shows more aggressive buying at the offer. Negative delta shows more aggressive selling at the bid.
That definition is mechanical. Interpretation is conditional.
Positive delta with upward price progress indicates aggressive buyers are lifting offers and gaining displacement. Positive delta without progress can reveal absorption if resting offers repeatedly hold the area. Negative delta with downward progress shows sellers hitting bids and moving the auction lower. Negative delta at a low that fails to extend can reveal bids absorbing the selling.
Cumulative delta adds another layer by tracking the net aggression through the session or selected calculation period. It is useful for comparing the internal auction with price structure, but it should not be read in isolation. A rising cumulative delta while price remains compressed beneath a known reference may indicate sustained lifting into available passive liquidity. A falling cumulative delta at a defended low may describe repeated selling into resting demand. The chart must show the response.
Distinguish Delta From Volume
High volume means substantial participation. High delta means an imbalance in aggression. Those are not interchangeable. A price can print high volume with near-zero delta when both sides transact heavily. That often matters at rotational areas, developing VPOCs, and active balance zones.
A useful footprint layout keeps volume and delta visually separate. Volume identifies where business occurred. Delta identifies which aggressive side initiated more of that business. The relationship between the two clarifies whether a bar was balanced, one-sided, absorbed, or simply active.
Use Imbalances to Map Urgency
Diagonal imbalance compares ask volume at one price with bid volume one tick below, or bid volume with ask volume one tick above. This comparison reflects how the auction crosses the spread. When the configured ratio is exceeded, the price level is marked as an imbalance.
A single imbalance is evidence of localized urgency. A stacked imbalance is more meaningful because aggressive participation persisted across consecutive prices. Still, color intensity is not a conclusion. A stacked ask imbalance climbing from the center of a balanced range is different from one appearing directly into an established high. The first may describe initiative activity through the auction. The second may meet resting liquidity immediately.
Set the imbalance ratio and minimum volume threshold to match the instrument and bar type. A low threshold can flood an active ES chart with markings that offer little hierarchy. A threshold set too high can hide meaningful participation during quieter periods. The goal is not maximum color. The goal is a readable distinction between ordinary execution and exceptional execution.
With SidiFootprint, the display can separate bid and ask cells, delta, volume, diagonal imbalances, and profile information without forcing a single visual convention. Use that flexibility to preserve hierarchy. The critical references should remain visible when the tape accelerates.
Identify Absorption and Exhaustion Separately
Absorption occurs when aggressive volume repeatedly trades into passive liquidity but price fails to extend through the level. The footprint often shows concentrated bid or ask volume at an extreme, substantial delta, and limited follow-through. It is a transaction event, not merely a reversal pattern.
For example, sellers may repeatedly execute at the bid near a session low. If price stops progressing lower while negative delta expands, passive bids may be absorbing the flow. The interpretation strengthens when the next auction rotates away and the low remains defended. Until that response appears, the footprint has shown heavy selling and stalled progress, not a completed narrative.
Exhaustion is different. It usually appears when the auction reaches an extreme with diminishing participation, thin prints, or a final isolated push that lacks continuation. Absorption says aggressive participants met passive liquidity. Exhaustion says the aggressive side may be running out of available urgency. They can occur together, but they should not be labeled as the same event.
This distinction matters in configuration. Absorption detection should emphasize meaningful executed volume and lack of price displacement. Exhaustion views often need clear visibility into low-volume extremes, unfinished auctions, and the transition between the final active prices and the next rotation.
Put VPOC and Value Areas on Every Read
The VPOC is the price with the greatest traded volume within the selected profile. It is a location of maximum activity, not a directional label. A developing VPOC can migrate as the session builds, showing where the current auction is concentrating business.
Value area boundaries frame where the bulk of profile volume has developed. When price operates inside value, footprint interpretation often shifts toward rotation, absorption at local extremes, and VPOC interaction. When price auctions outside established value, the central question becomes whether volume builds and holds outside that area or whether activity rejects back through the boundary.
Use session profiles and bar-level profiles for different jobs. The session profile provides the larger auction map. A bar profile shows where participation concentrated within a specific interval. Dual independent profile columns are especially useful when one column tracks the developing session and the other exposes each bar's internal VPOC and volume distribution.
A footprint event gains weight when it aligns with profile structure. Heavy ask-side activity at a developing VPOC may reflect two-sided trade rather than directional urgency. The same activity outside value, followed by sustained acceptance, describes a different auction condition.
A Futures Footprint Interpretation Workflow
Start each reading from the outside and move inward. Mark the session high and low, prior structural references, value boundaries, developing VPOC, and low-volume areas. Then assess whether the current auction is balancing, extending, or rejecting.
Next, inspect the footprint bars at those references. Compare bid and ask volume, bar delta, stacked imbalances, and the response after exceptional prints. Finally, use cumulative delta and developing profile migration to test whether the internal flow agrees with the price behavior or is being absorbed.
This sequence is deliberately slower than reacting to the brightest cell. It creates a repeatable reading process during fast conditions: location, aggression, response, acceptance. A footprint becomes useful when each layer confirms or challenges the others.
Configure for Fast Recognition, Not Maximum Decoration
A dense footprint can become unreadable when every available statistic competes for attention. Prioritize the values that support your auction framework. For many active futures charts, that means bid x ask, delta, diagonal imbalance markers, bar VPOC, session VPOC, value area, and clear extreme highlighting.
Use font size, cell width, color contrast, and opacity to establish visual rank. Major imbalance stacks should be distinguishable from ordinary cells. Developing VPOC should remain visible without obscuring prices. Alerts can draw attention to defined structural events, but the chart should retain enough clarity that the event is understandable at a glance.
The best layout is not the one showing the most data. It is the one that lets you identify where aggressive participation met liquidity, whether the auction accepted the area, and where the next concentration of volume is developing.
Footprint interpretation improves when the chart is treated as a live auction ledger rather than a collection of isolated patterns. Keep the profile visible, keep the key references stable, and let price response decide what the executed volume actually means.
See it on your own chart.
Every Sidi tool is unlocked in the free 14-day demo. Install SidiFootprint in NinjaTrader 8 and load one of the finished color styles to start.
Start free 14-day demo → SidiFootprint features Browse color stylesRelated articles
Stacked Imbalance Trading Strategy for Futures
Build a stacked imbalance trading strategy for futures with footprint context, delta, VPOC, absorption, and developing auction structure in real time.

NinjaTrader 8 Footprint Chart for Faster Reads
Build a NinjaTrader 8 footprint chart that exposes delta, imbalances, absorption, VPOC, and auction context when futures order flow accelerates fast.
Futures Order Flow Visualization Guide for E-mini
Use this futures order flow visualization guide to configure footprint, delta, VPOC, profiles, and imbalance context for fast E-mini auctions each day.