
What Causes Footprint Absorption at Key Levels?

A footprint can show thousands of contracts lifting the offer at a session high while price barely advances one tick. That mismatch is the core of what causes footprint absorption: aggressive orders are executing, but passive liquidity is willing and able to take the other side without immediately yielding price.
For order-flow traders, absorption is not a candle pattern and it is not a label to apply to every high-volume bar. It is an auction condition. The footprint shows the aggression that traded at each price, while the bar's progress - or lack of progress - reveals whether that aggression changed the auction.
What Causes Footprint Absorption?
Footprint absorption occurs when aggressive market participants repeatedly transact into resting limit liquidity, yet price cannot continue efficiently through that level. Buyers crossing the spread and executing at the ask meet passive sellers. Sellers hitting the bid meet passive buyers. The printed volume is real, but the available liquidity is sufficient to contain it.
The cause is therefore an imbalance between executed aggression and passive response. A large positive delta does not automatically produce higher prices if offer-side liquidity continues to refill. Likewise, heavily negative delta can appear at a low while passive buyers continue absorbing sell market orders.
The footprint cannot identify the identity or intent of the passive participant. It does not prove that one large participant is defending a price, nor can it directly display every resting order that was canceled or reloaded. What it can show precisely is the sequence that matters: substantial bid or ask execution, unusually concentrated volume, and limited price acceptance beyond the level.
Passive Liquidity That Reloads
The clearest form of absorption occurs when liquidity repeatedly replenishes at one price or in a narrow price band. For example, the ask at an intraday high may print large volume across several developing bars. Buyers continue lifting that ask, but each push encounters more passive sell liquidity. The high remains intact despite persistent positive delta.
This can occur through visible resting depth, replenishment after fills, or reserve-style behavior not fully visible in displayed depth. The footprint should be read from executions first. Depth can provide context, but displayed size is not a complete record of the liquidity that actually traded.
Aggression at an Auction Extreme
Absorption is especially meaningful at locations where the auction is already under pressure: a prior session high or low, value area high or low, a prominent VPOC, an overnight extreme, or a sharply defined balance edge. At these locations, one-sided execution has a clear test. Can the auction gain acceptance beyond the reference, or does aggressive volume accumulate without extension?
The location does not create absorption by itself. It gives the event structure. Heavy ask volume in the middle of a rotational range may simply reflect two-way participation. The same ask volume at a tested high, followed by stalled progress and rejection back into the prior range, has a different auction meaning.
How Footprint Absorption Appears on the Chart
Absorption is a relationship among volume, delta, price movement, and location. Looking at only one field creates false positives.
At a potential high-side absorption area, the footprint often shows elevated ask volume, positive delta, ask-side imbalances, or stacked diagonal imbalances near the upper prices of the bar. Yet the bar may develop slowly, fail to extend, or close away from its high. On the opposite side, potential low-side absorption can show heavy bid volume, negative delta, bid-side imbalances, and limited ability to print lower prices.
A useful distinction is between activity and result. Large volume is activity. Delta shows the directional skew of aggressive execution. Price response shows whether that activity moved the auction. Absorption becomes visible when aggressive activity is strong but its directional result is weak.
Delta Must Be Read With Progress
Positive delta at a high is not inherently bearish, and negative delta at a low is not inherently bullish. The contextual question is whether price is accepting that direction.
If positive delta accompanies consecutive higher prices, expanding range, and sustained trade above the prior high, buyers may be gaining acceptance despite passive selling. If positive delta expands while the high remains fixed and the bar rotates lower, those ask executions may be getting absorbed. The same logic applies in reverse at lows.
Cumulative delta adds another layer, but it should not replace the price-level footprint. Cumulative delta can continue higher while price stalls because aggression is being absorbed over several bars. A divergence becomes more informative when the footprint identifies the exact price levels where the execution concentrated.
Volume Concentration Matters
A single large print can matter, but absorption is usually more credible when volume repeatedly concentrates at a defended level. Watch for several bars printing meaningful volume at the same high or low, particularly when the level remains unchanged. A developing VPOC that holds near the extreme can also show where the session's participation is accumulating.
That said, high volume at an extreme can also mark acceptance. If the auction begins building volume above a former high rather than rejecting back below it, the level may be transitioning from resistance into accepted trade. The footprint records the transfer of contracts; the evolving profile and subsequent price location determine whether acceptance is occurring.
Absorption Versus Exhaustion
Absorption and exhaustion can appear together, but they describe different mechanics.
Absorption requires a passive counterparty taking aggressive flow. Large ask volume at a high that fails to advance points to offer-side absorption. Large bid volume at a low that fails to extend points to bid-side absorption.
Exhaustion is a reduction in aggressive participation. At a high, it may appear as thinning ask volume after a directional push. At a low, bid volume may dry up. There may be little evidence of a large passive participant because the initiating side simply stops pressing with the same intensity.
The difference matters for chart interpretation. An exhausted move can pause and later continue if new aggression enters. An absorbed move has demonstrated that aggression was already present and met meaningful opposing liquidity. In fast conditions, both can unfold within the same price sequence: initiative volume drives into an extreme, passive liquidity contains it, then the aggressive side thins out.
Configure the Footprint for Absorption Visibility
An absorption read is only as useful as the chart layout makes it. The goal is to show executed volume and auction context without burying the developing bar under unnecessary fields.
Start with bid-by-ask volume at each price level and keep delta visible at either the cell or bar level. Diagonal imbalances are useful because they compare ask volume at one price with bid volume one tick below, or bid volume with ask volume one tick above. This isolates aggressive pressure more clearly than raw volume alone.
Color thresholds should be calibrated to the instrument and bar construction. A fixed threshold that highlights meaningful ES volume during one period may over-highlight normal activity during a faster session. Relative thresholds, or separate color tiers for moderate and extreme volume, make the footprint readable as conditions change.
Add a session profile with VPOC and value areas so the footprint is not interpreted in isolation. A second independent profile column can display a different reference structure, such as a composite profile beside the active session. This makes it easier to see whether absorption is occurring at a local bar extreme, a session boundary, or a larger auction reference.
SidiFootprint supports independent footprint, profile, imbalance, and developing-bar controls in the same NinjaTrader 8 workspace. The practical advantage is not more decoration. It is the ability to keep the exact fields needed for a fast absorption read visible while preserving the profile context that gives the event meaning.
Common Absorption Misreads
The most common error is calling any high-volume reversal absorption. A reversal bar can form for many reasons, including short-term position adjustment, a sudden reduction in aggression, or normal two-way trade at a high-volume node. Absorption needs evidence that aggressive executions were actively met at a specific price or narrow zone.
Another error is treating stacked imbalances as proof of continuation. Stacked ask imbalances near a high show determined buying at the ask. They do not tell you whether offer liquidity above is being consumed or replenished. The next prints, the ability to hold above the level, and the developing profile provide that distinction.
Finally, do not freeze the analysis at bar close. The developing footprint matters because absorption is a live process. A bar may initially show heavy ask-side execution at its high, then later trade through that price and build acceptance above it. What looked like containment was only temporary liquidity. Reading the developing auction prevents a static screenshot from becoming a fixed conclusion.
When a footprint shows aggressive volume meeting an unyielding price, keep watching the response rather than the headline delta. The auction will show whether liquidity is being consumed, reloaded, or accepted through - one executed price level at a time.
See it on your own chart.
Every Sidi tool is unlocked in the free 14-day demo. Install SidiFootprint in NinjaTrader 8 and load one of the finished color styles to start.
Start free 14-day demo → SidiFootprint features Browse color stylesRelated articles
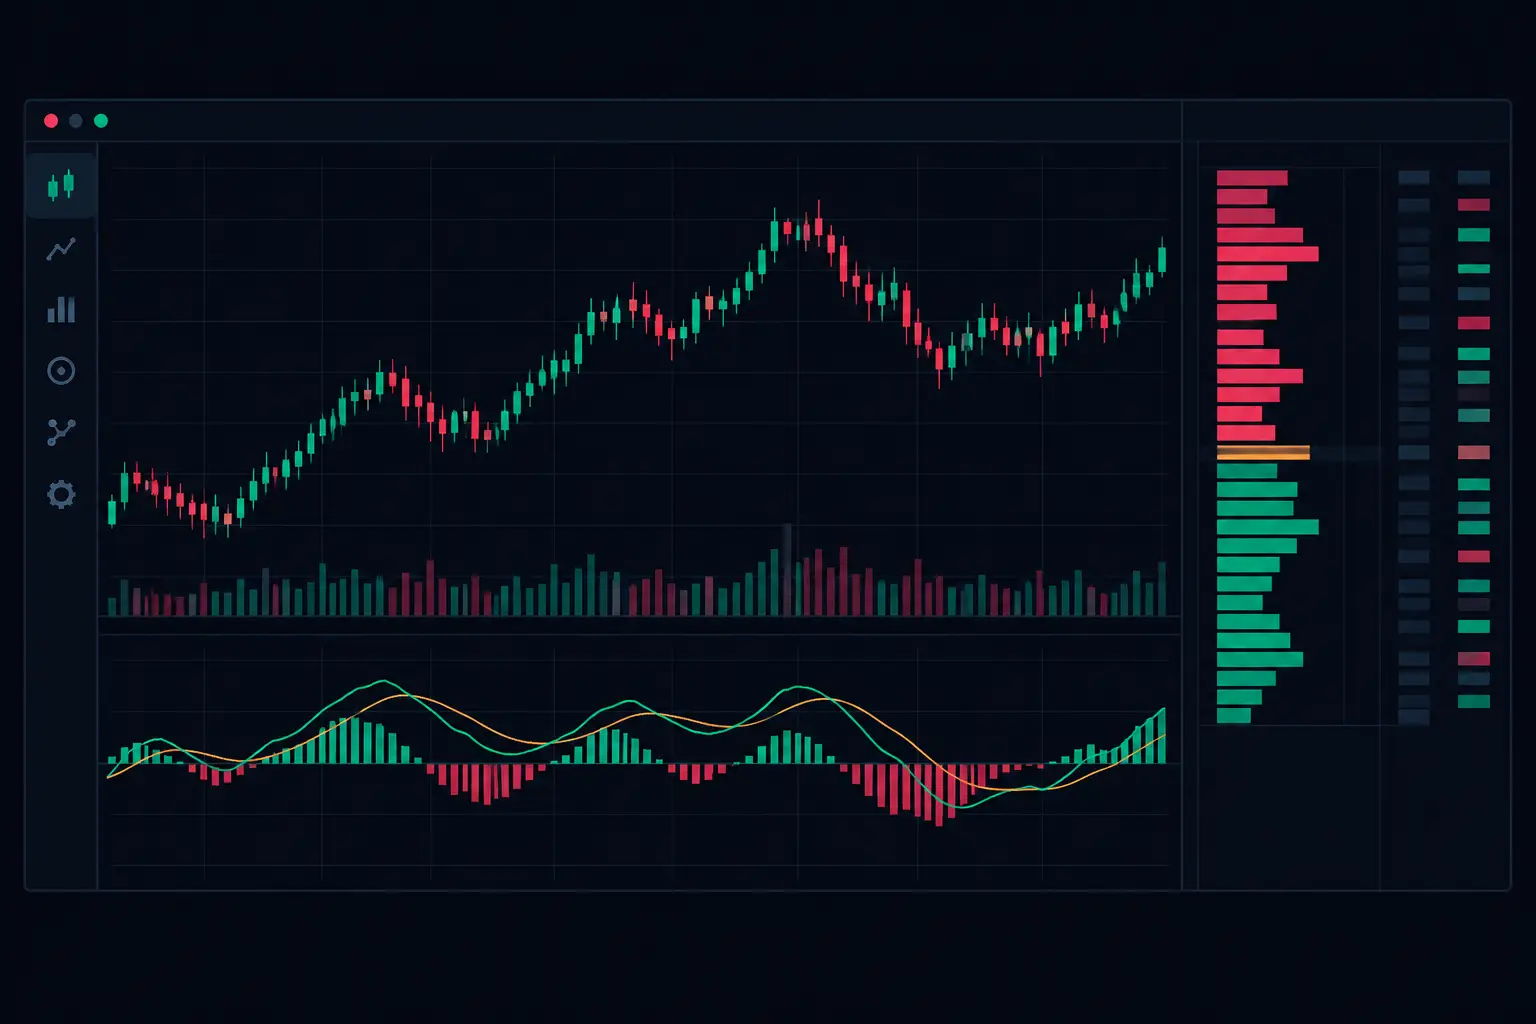
Delta Divergence Charts for Faster Auction Context
Delta divergence charts expose disagreement between price and aggressive volume, helping futures traders read absorption, exhaustion, and auction context.

Order Flow Scalping for Fast Futures Markets
Order flow scalping reads executed volume, delta, liquidity, and response at each price so futures traders can frame fast intraday auctions with precision.
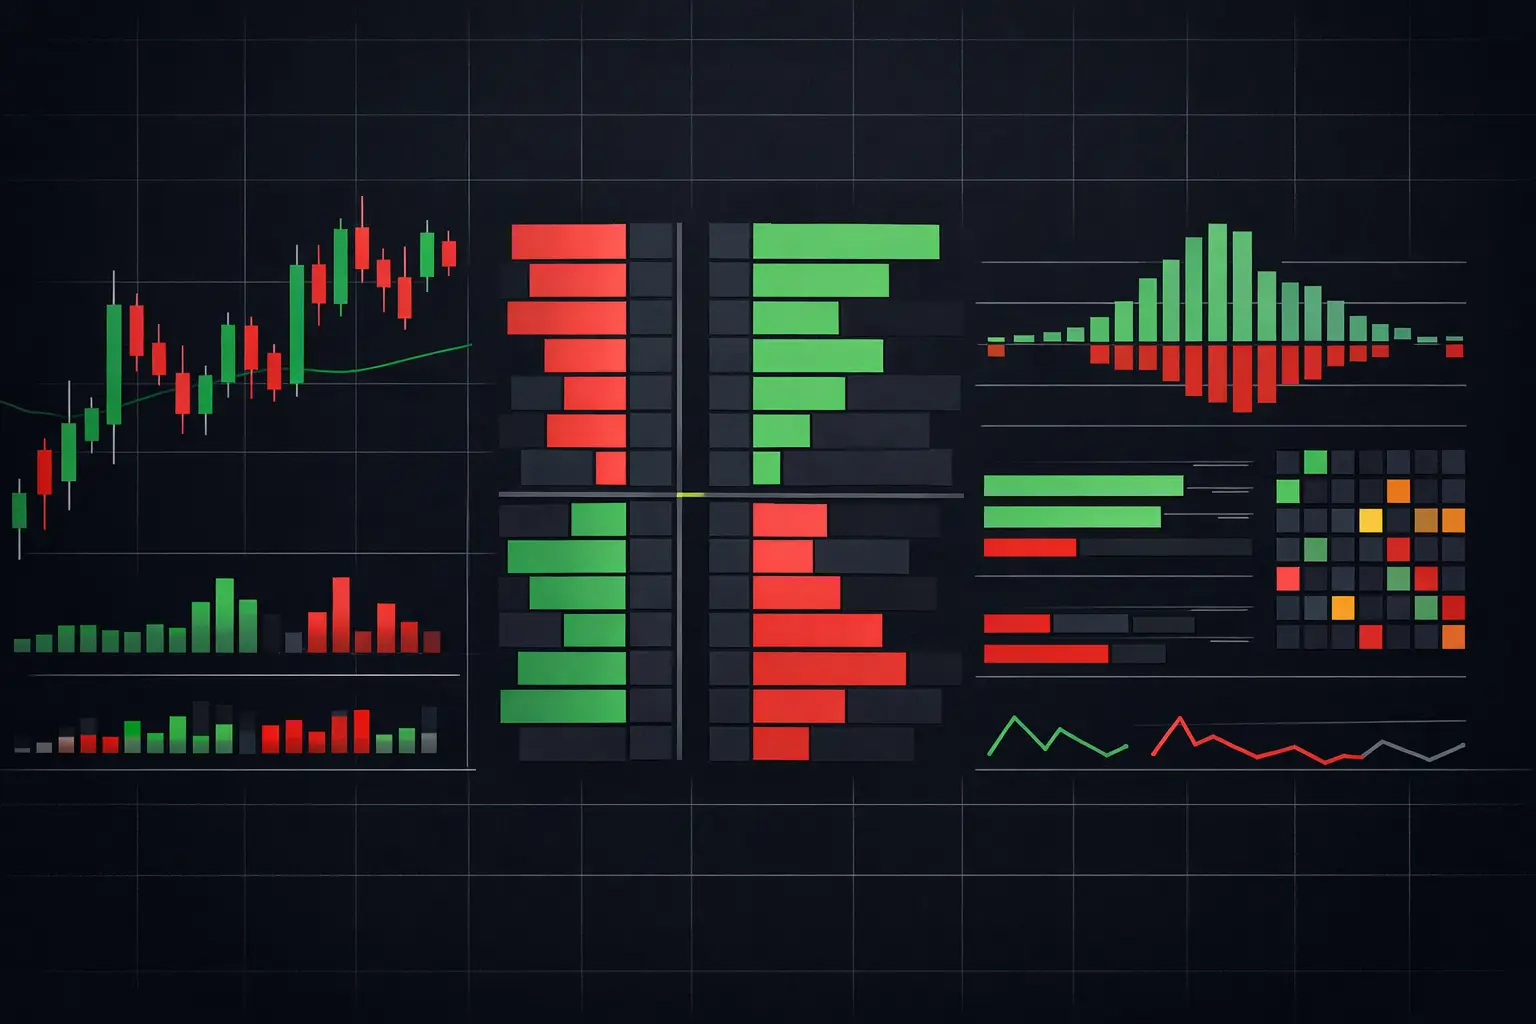
Big Lot Order Flow Indicator for Futures Charts
A big lot order flow indicator separates concentrated aggressive volume from passive absorption, so futures charts show size, location, and response live.