
Big Lot Order Flow Indicator for Futures Charts
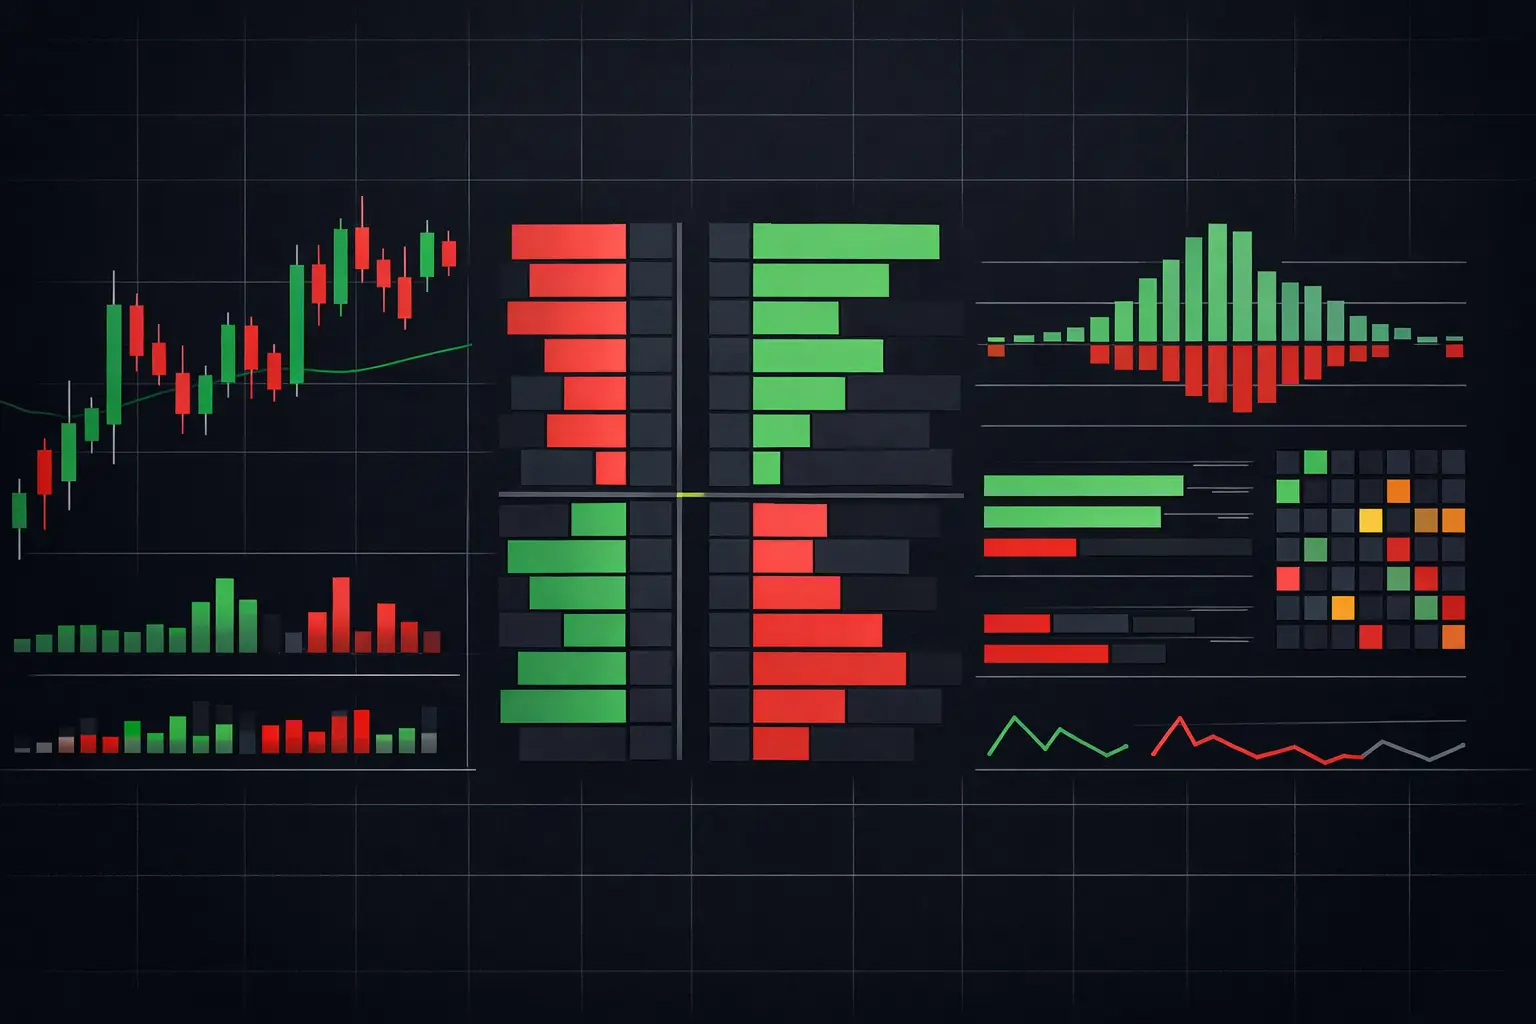
A 2,000-contract print means very little if it is viewed without price location, aggressor side, and the market response that followed. A big lot order flow indicator is built to put those elements in the same visual field. Instead of treating volume as one total at the bottom of a candle, it shows where concentrated participation occurred, whether it lifted the offer or hit the bid, and whether passive liquidity absorbed it.
For active futures traders, size is not context by itself. The useful question is whether large activity changed the auction. A burst of offer-side volume through a prior high has a different structure from the same volume repeatedly transacting into a resting seller. Footprint data, delta, VPOC, and developing profiles turn that distinction into something visible at the price level.
What a Big Lot Order Flow Indicator Actually Measures
The phrase "big lot" is often used loosely. In futures, it usually describes unusually large executed volume, a high concentration of trades, or repeated size transacting at a narrow group of prices. The relevant threshold depends on the instrument, session, and current pace. A size filter that highlights meaningful ES activity during the US cash session may be too low during a high-volatility release or too high during a quiet overnight rotation.
A properly configured big lot order flow indicator should therefore let the chart define size relative to the instrument rather than impose one universal number. The display can emphasize large bid volume, large ask volume, total volume, or unusually large individual trade counts while preserving the full bid-by-ask structure of the bar.
That distinction matters because a footprint is not merely a volume histogram inside a candle. Each row represents activity at one price. Bid volume identifies market orders transacting against resting bids. Ask volume identifies market orders transacting against resting offers. Delta is the difference between those two sides. When large activity appears, the chart must preserve its side and location or the critical auction information disappears.
Size without response is incomplete
A large aggressive buyer can lift substantial offer volume and still fail to push price higher if a passive seller continues replenishing liquidity. That is absorption. Conversely, moderate but persistent ask-side activity can move price quickly when resting offers are thin.
This is why raw large-print highlighting can be misleading when used alone. The chart needs to show the relationship between the print, cumulative delta, nearby liquidity, and the next few price levels. A big lot event at the edge of a developing value area has a different meaning from the same event in the middle of a balanced profile.
Read Large Activity at the Price Level
The highest-value workflow begins with a footprint chart that retains enough detail to distinguish initiative from response. Set the price aggregation appropriately for the instrument and pace. One-tick rows preserve maximum detail in liquid markets, while multi-tick aggregation can reduce visual noise when the chart is moving too quickly to read cleanly.
Then establish the volume view. Bid-by-ask volume is the foundation because it shows the aggressor side directly. Add total volume when identifying concentration matters, and add delta when comparing the pressure inside a bar to the bar's actual range. A positive delta bar that cannot extend upward is often more informative than a positive delta bar that simply continues an existing drive.
Large lots should be highlighted with color, font weight, background shading, or a dedicated filter. The visual rule must be obvious at a glance. If the threshold is too permissive, the chart becomes a field of colored numbers. If it is too restrictive, only extreme events remain and the sequence leading into them is lost.
A practical threshold should be calibrated from recent activity. Review several comparable periods in the same instrument and identify the volume levels that recur routinely versus the levels that stand out. Revisit that threshold when session conditions change. Static settings are convenient, but the tape is not static.
Compare aggressive volume diagonally
Diagonal imbalances are especially useful around large lots because they compare ask volume at one price with bid volume one tick below, or bid volume at one price with ask volume one tick above. This follows the path of the auction more closely than comparing volume across the same row.
For example, large ask volume at 5,250.00 paired with materially smaller bid volume at 5,249.75 can form a buy-side diagonal imbalance. A sequence of these imbalances can show aggressive lifting through multiple prices. If the sequence stalls against heavy offer-side absorption, the footprint reveals both sides of the interaction: initiative activity arrived, and passive liquidity answered.
Stacked imbalances add further structure. A single imbalance can be incidental. Several consecutive imbalances show sustained aggression through a price zone. When that zone aligns with a developing VPOC migration or a profile edge, the chart provides a far more complete read than a large lot marker alone.
Add Profile Context Before Interpreting the Print
Every large transaction occurs within an auction. Volume profile context determines whether the activity is occurring in accepted trade, at a value boundary, or in a low-volume area where price can move more freely.
Use a session profile to locate the VPOC, value area, high-volume nodes, and low-volume nodes. Then keep those references visible as the footprint develops. Large bid-side volume at a session VPOC can indicate active participation within accepted trade. Large ask-side volume lifting through a low-volume area can show a very different structural condition, particularly if the developing VPOC begins moving upward behind the activity.
Dual independent profile columns are useful here. One column can display the current session's developing volume profile while another displays a larger composite or a separate reference period. This prevents an intraday footprint event from being read in isolation. The trader can see whether concentrated activity is occurring at a local auction point, a broader distribution edge, or directly into an established high-volume node.
Cumulative delta adds another layer, but it should not replace the footprint. It summarizes net aggressive activity across time. The footprint identifies where that activity occurred. A cumulative delta extreme with no corresponding range extension may point to absorption; a footprint shows the exact prices where the imbalance met passive interest.
Configure the Chart for Speed, Not Decoration
Fast markets punish layouts that require constant interpretation. The best big-lot display is not the one with the most visual effects. It is the one that makes the relevant exceptions immediately visible while keeping the underlying auction readable.
Start with a compact hierarchy. Keep bid and ask volume readable first. Use large-lot highlighting second, diagonal imbalance coloring third, and profile references around the footprint. Add delta, VPOC, and cumulative delta only when each element has a defined role in the layout. If multiple colors describe the same condition, reduce them.
SidiFootprint supports the level of configuration needed for this approach: separate visual controls for volume, delta, imbalances, absorption, exhaustion, profiles, and developing bars. The point is not to activate every feature. It is to build a chart where each feature answers a different question about the auction.
Alerts can be configured for conditions such as unusually large volume, stacked imbalances, absorption, or exhaustion. Text-to-speech can be valuable when the chart is not the only active workspace. But alert conditions require the same discipline as visual thresholds. A frequent alert is background noise, not useful market information.
Watch developing bars carefully
A completed footprint bar is a record. A developing bar is an active negotiation. Large ask volume can appear, disappear into the completed structure, and be followed by immediate counteractivity. Treat the developing bar as a real-time view of participation, not a finished statement about the session.
This is also where platform performance matters. If a footprint refreshes slowly, the relationship between large lots, liquidity response, and price movement is seen late or not at all. A high-performance order-flow display is not cosmetic. It determines whether the chart remains readable when volume accelerates.
Common Reading Errors
The first error is treating every large print as directional. Large volume can reflect aggression, absorption, liquidation, two-sided trade, or a transition from one area of acceptance to another. The print becomes useful only after the chart shows the response.
The second is ignoring location. A large lot at the center of a mature high-volume node is often structurally different from one at a session extreme or just beyond a low-volume area. Volume profile references are what make that distinction visible.
The third is using a threshold that never changes. ES, NQ, CL, and other futures contracts have different participation patterns. Even within one contract, the relevant threshold changes with time of day and volatility. Calibrate the display to what is actually printing now.
Finally, avoid reading delta as a standalone verdict. Delta records who crossed the spread. It does not show whether passive liquidity allowed price to continue. Pair it with footprint rows, stacked imbalances, absorption markers, and the developing profile.
A well-built big lot order flow indicator should leave the chart cleaner, not louder. When size, aggressor side, price location, and response are visible together, the tape stops being a collection of isolated numbers and becomes a readable auction.
See it on your own chart.
Every Sidi tool is unlocked in the free 14-day demo. Install SidiFootprint in NinjaTrader 8 and load one of the finished color styles to start.
Start free 14-day demo → SidiFootprint features Browse color stylesRelated articles
What Causes Footprint Absorption at Key Levels?
Learn what causes footprint absorption in futures, how passive liquidity absorbs aggression, and how delta, volume, and price response expose it live.
Order Flow Scalping for Fast Futures Markets
Order flow scalping reads executed volume, delta, liquidity, and response at each price so futures traders can frame fast intraday auctions with precision.
Cumulative Delta Indicator NinjaTrader 8 Setup
Configure a cumulative delta indicator NinjaTrader 8 chart to track aggressive order flow, session context, divergence, absorption, and pace in real time.