
Order Flow Scalping for Fast Futures Markets
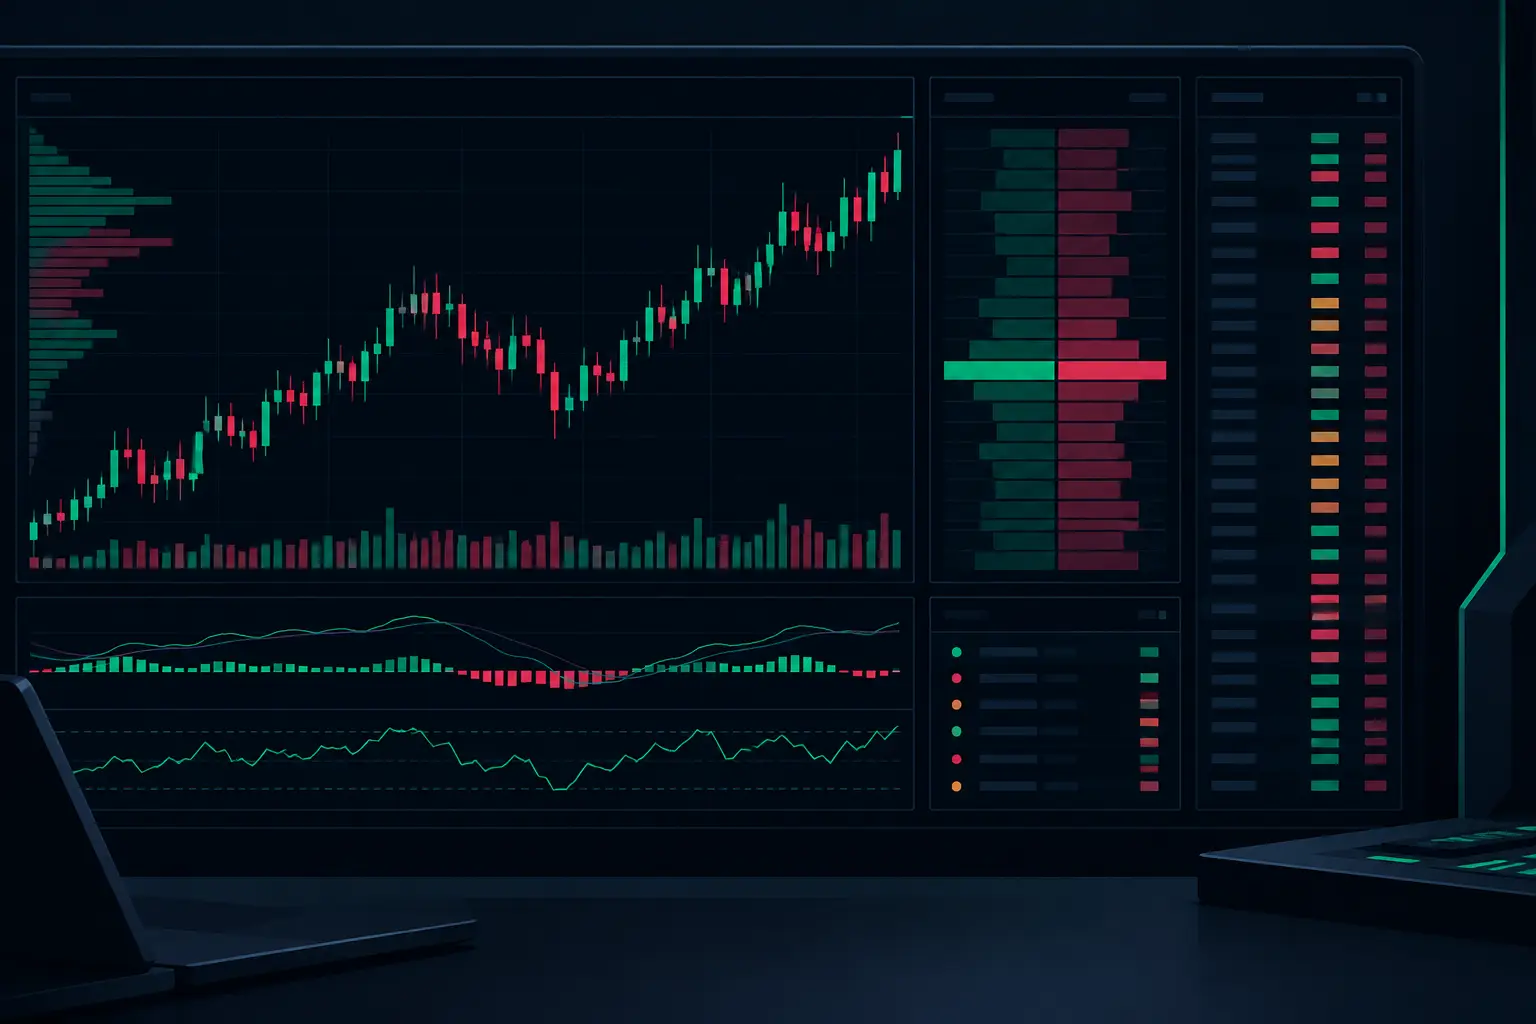
Order flow scalping is not a faster version of candle reading. It is a way to inspect the auction at the price levels where it is actually being contested: who crossed the spread, where passive liquidity held, where it pulled, and whether aggressive volume produced displacement or simply met absorption. On a fast ES session, that distinction can change several times before a conventional bar tells a coherent story.
The objective is not to treat every footprint print as meaningful. A footprint becomes useful when it organizes executed bid and ask volume into context: the session profile, the developing VPOC, nearby value, prior auction extremes, and the current pace of trade. Without that context, a large delta number is only a large number.
What Order Flow Scalping Measures
A scalper working from order flow is reading interaction rather than appearance. Candles show where price opened and closed over a selected interval. The footprint shows the transactions inside that interval, price by price. Bid volume identifies contracts executed against resting bids; ask volume identifies contracts executed against resting offers. Delta is the difference between those two values.
That distinction matters most at inflection points. An upswing can contain repeated ask-side aggression, but if price stops advancing while ask volume continues to build, passive offers may be absorbing the activity. Conversely, a selloff can print heavy bid-side volume into a level and then fail to extend as the offered liquidity is consumed or withdrawn. Neither condition is a standalone instruction. Both are evidence about how the current auction is behaving.
For order flow scalping, the useful question is usually: did aggressive participation move price through the level, or did the level absorb it? That question keeps the chart anchored to response rather than raw volume.
Delta needs location and follow-through
Delta is frequently misread because traders isolate it from price acceptance. Positive delta at the upper edge of a balanced area means something different from positive delta that drives price cleanly through a prior high and holds there. The first may show initiative activity meeting a passive seller. The second may show acceptance above an auction boundary.
Cumulative delta adds another layer by showing the running imbalance between aggressive buyers and sellers through the session. It can clarify whether a local rotation is occurring against persistent initiative pressure or inside a two-sided auction. But cumulative delta is not a replacement for the footprint. It summarizes participation; the footprint identifies where that participation occurred.
Build the Chart Around the Auction
A clean scalping layout should answer three questions without requiring a screen full of detached studies: Where is value? Where is the current high-volume reference? What is occurring at the price currently under negotiation?
Start with a footprint bar configured for bid x ask volume, delta, or both. The appropriate display depends on what you need to see during execution. Bid x ask makes the interaction at each level explicit. Delta can compress that information when the chart is moving quickly, but it gives up some detail. Many active traders keep both available in separate views or switch based on market pace.
Add a session volume profile with a visible VPOC and value area. The VPOC is not a magnet by definition, nor is it a fixed turning point. It is the price with the greatest accumulated volume within the chosen profile. In a balanced session, it often becomes a useful center of trade. In a directional auction, the developing VPOC can migrate as acceptance shifts higher or lower.
Then define the references that matter for the instrument and session: prior session high and low, prior VPOC, value-area boundaries, overnight extremes, opening range, and obvious composite profile edges. Order flow scalping is more selective when the footprint is read at a known reference rather than in the middle of unstructured rotation.
Use imbalance settings deliberately
A diagonal imbalance compares ask volume at one price with bid volume one tick below it, or bid volume at one price with ask volume one tick above it. This aligns the comparison with how aggressive orders interact across adjacent prices. A stacked imbalance occurs when multiple consecutive prices meet the selected threshold.
Threshold selection is instrument-specific. A setting that exposes meaningful participation in ES can overmark a thinner contract, while a threshold tuned for a quieter period can hide relevant activity during the cash open. The goal is not to color as many cells as possible. It is to make unusually one-sided execution visible without turning the footprint into a solid block of highlights.
Use minimum-volume filters with the same discipline. An imbalance ratio applied to tiny volume can produce visually dramatic but structurally weak marks. Requiring meaningful traded volume removes much of that noise. During faster conditions, increasing the minimum may make the display more readable; during slow rotations, a lower threshold can preserve detail.
Read Absorption Before Chasing Extension
Absorption is one of the most useful conditions for a scalper because it describes a mismatch between aggressive execution and price movement. At a high, repeated ask-side volume may transact while price cannot advance beyond a narrow range. At a low, repeated bid-side volume may trade while price refuses to continue lower. The key is not the presence of volume alone. It is the inability of that volume to produce further auction progress.
Look for a sequence rather than a single print. Suppose price pushes into a prior high. Ask volume expands at the high, positive delta accumulates, and the footprint shows repeated activity at one or two prices. If the next developing bars fail to hold above that level and trade rotates back through it, the chart has documented failed extension after aggressive buying. The same logic applies in reverse at a low.
Exhaustion differs from absorption. Exhaustion is a reduction in aggressive participation near an extreme, often visible as thinning volume after a sustained move. Absorption requires the opposing passive side to take the incoming aggression. These conditions can occur together, but they should not be labeled interchangeably.
A well-configured footprint can display absorption and exhaustion conditions in real time, yet the trader still needs to judge location. Exhaustion in the center of value may simply reflect a pause. Exhaustion at a session extreme after an extended auction has a different informational weight.
Use Developing Bars, Not Finished-History Logic
Scalping decisions occur while a bar is developing. Any chart workflow that only looks clean after the bar closes is late by design. The practical requirement is to see bid/ask volume, delta, imbalances, and profile development update without obscuring the current auction.
Watch how the developing bar behaves around a reference. Does volume build at one price and hold? Does the VPOC shift with price, showing acceptance? Does a stacked imbalance appear and then immediately fail to attract continued trade? Does delta expand while range contracts? These are process observations, not fixed patterns.
This is also where display performance matters. A footprint chart that lags during heavy transaction flow forces the trader to interpret stale information. SidiFootprint is designed for NinjaTrader 8 workflows where the chart must continue rendering detailed price-level data as conditions accelerate. Its configurable footprint, dual independent profile columns, developing VPOC, and absorption or exhaustion displays let the trader organize the same auction from more than one angle without fragmenting the workspace.
A Repeatable Order Flow Scalping Routine
The routine should be simple enough to execute when the tape is fast. Before the active session, mark profile references and establish the footprint settings appropriate for the instrument's normal volume. At the open, observe whether trade is accepting inside prior value, rejecting an edge, or building new value outside the prior range.
When price reaches a reference, narrow the focus. Read the bid x ask cells, delta, imbalance sequence, and pace of transactions together. Then wait for the market's response to aggressive activity. A burst of offer lifting is not meaningful simply because it is large. It becomes meaningful when price accepts above the level, fails there through absorption, or rotates back into the prior auction.
After a rotation or extension, reassess the developing profile. If the VPOC has migrated and volume is accumulating at new prices, the auction has changed character. If price has moved but volume remains concentrated at the old center, the move may still be probing away from established value. This ongoing reassessment is what separates order-flow work from memorizing static footprint shapes.
Configure for Clarity, Not Maximum Information
More data does not automatically improve visibility. Excessive color gradients, every possible imbalance marker, and multiple overlapping profiles can hide the very response you need to see. Use color to prioritize information: aggressive imbalance, delta extremes, absorption zones, and VPOC. Keep the hierarchy consistent so the eye can interpret the chart under pressure.
Test configuration changes one at a time. Adjust an imbalance ratio, minimum volume, font size, profile placement, or delta coloring, then observe how that change affects readability across several market conditions. A layout that works during the midday auction may become too dense at the open. Independent settings for profiles and footprint columns make it possible to preserve the larger auction context while keeping execution detail legible.
The best order flow scalping chart does not promise certainty. It makes the auction easier to audit in real time: where volume traded, which side initiated, where liquidity absorbed that activity, and whether price accepted the result. Keep the chart focused on those questions, and each developing bar has a clearer job to do.
See it on your own chart.
Every Sidi tool is unlocked in the free 14-day demo. Install SidiFootprint in NinjaTrader 8 and load one of the finished color styles to start.
Start free 14-day demo → SidiFootprint features Browse color stylesRelated articles
Futures Order Flow Visualization Guide for E-mini
Use this futures order flow visualization guide to configure footprint, delta, VPOC, profiles, and imbalance context for fast E-mini auctions each day.
What Causes Footprint Absorption at Key Levels?
Learn what causes footprint absorption in futures, how passive liquidity absorbs aggression, and how delta, volume, and price response expose it live.
NinjaTrader Order Flow Alerts for Fast Markets
NinjaTrader order flow alerts turn footprint events, delta shifts, and absorption into immediate chart and audio awareness during fast futures sessions.