
NinjaTrader Order Flow Alerts for Fast Markets
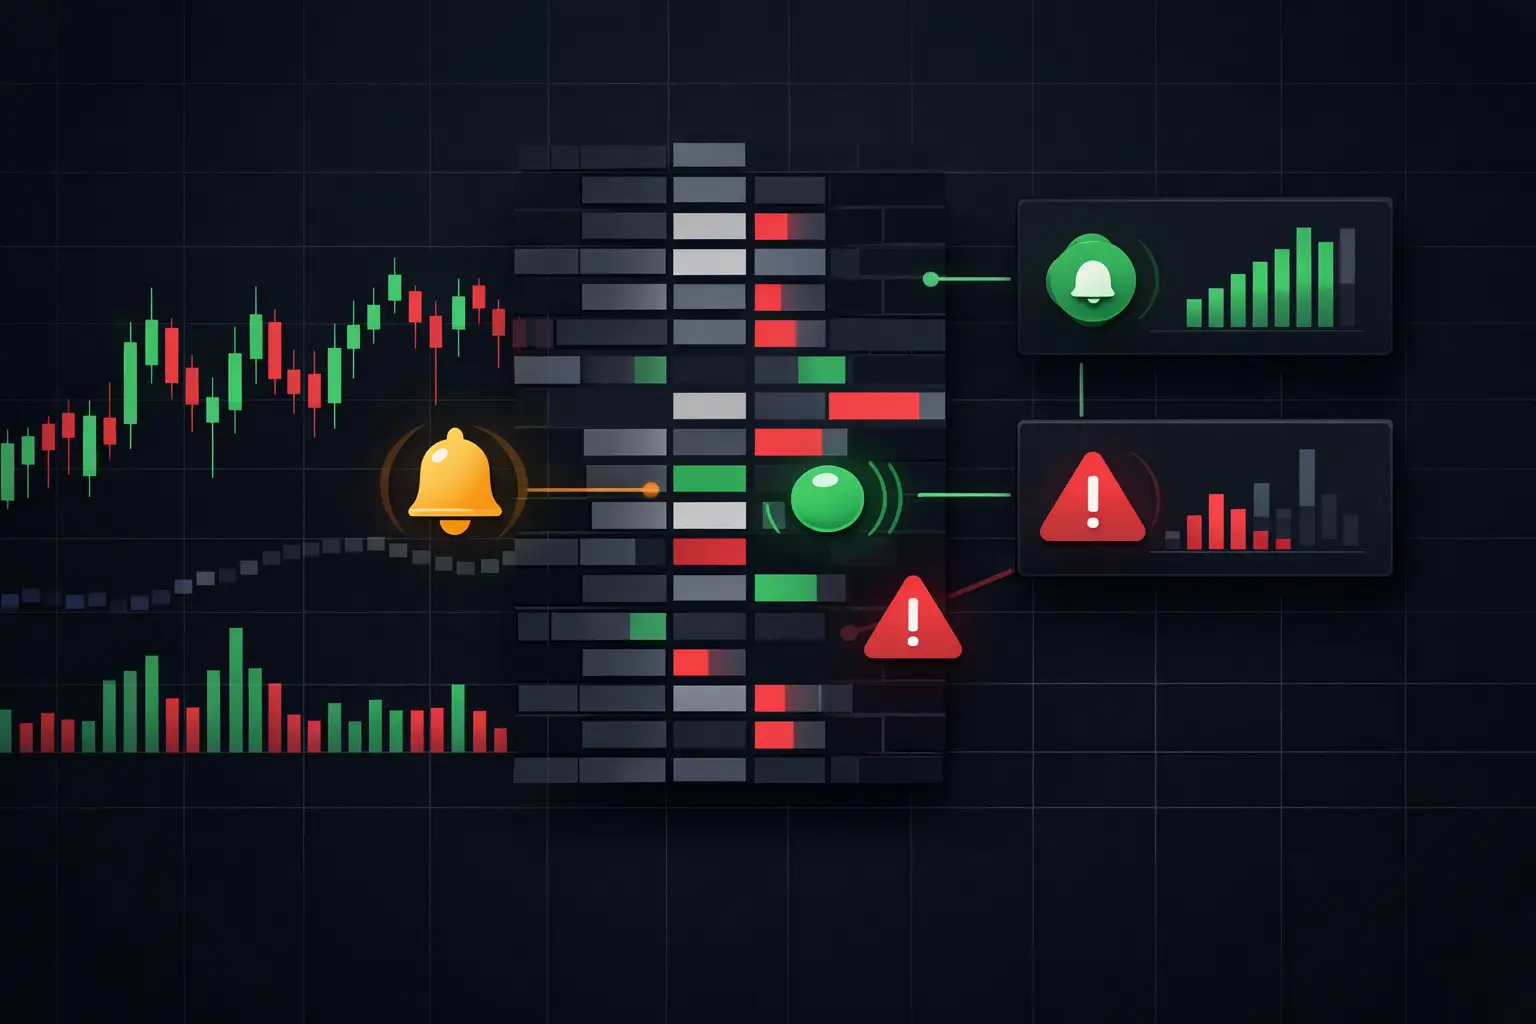
A developing footprint can change character in seconds. Aggressive volume may lift through several price levels, then stall against passive liquidity. Delta can expand while price fails to extend. A session VPOC can migrate, hold, or reject. NinjaTrader order flow alerts are built for this moment: they turn a condition already visible in the order flow into an immediate chart, sound, or text-to-speech notification so the event is not buried inside a fast-moving bar.
The objective is not to fill a workspace with noise. It is to define a small set of auction conditions that matter to your methodology, then let the platform call attention to them while you retain full context from footprint, profile, delta, and structure.
What NinjaTrader Order Flow Alerts Should Detect
An alert is only as useful as the calculation behind it. A simple price-level alert can tell you that the instrument reached a number. Order-flow alerts should explain what occurred at that number: aggressive participation, passive response, relative volume, imbalance, or a developing profile change.
For footprint users, the most useful conditions usually originate at the price level rather than from a completed candle. This distinction matters. A completed bar is historical confirmation of what occurred during its construction. A developing footprint exposes the auction as it forms, including whether ask volume is lifting, bid volume is pressing, or absorption is preventing extension.
Useful event families include diagonal and horizontal imbalances, stacked imbalances, volume thresholds, delta thresholds, absorption, exhaustion, VPOC interaction, and value-area interaction. Each measures a different part of the auction. Combining them indiscriminately creates duplicate notifications. Separating them by purpose creates a cleaner operating workflow.
A stacked ask imbalance, for example, identifies multiple adjacent price levels where ask volume exceeds the comparable bid volume by a configured ratio and minimum volume. A stacked bid imbalance applies the inverse logic. The alert is not the analysis itself. It is a prompt to inspect location: Is the stack forming above balance, at a prior high-volume node, through a thin profile area, or directly into opposing passive volume?
Build Alerts From a Defined Footprint Calculation
Before setting any notification, establish the footprint calculation and display rules. Bid-by-ask data, volume delta, trade count, and imbalance ratio can each produce materially different visual results. An alert tied to a loosely defined display becomes difficult to interpret when the tape accelerates.
Start with the data type that matches the condition. For imbalance detection, bid-by-ask footprint values provide the required comparison. A diagonal imbalance compares ask volume at one price with bid volume one tick below for buying pressure, or bid volume with ask volume one tick above for selling pressure. Horizontal comparison uses activity at the same price. These are not interchangeable calculations, so the threshold that works for one should not be copied blindly to the other.
Then set the minimum volume filter. An imbalance ratio alone can overemphasize small prints during quiet periods. A minimum-volume requirement keeps the alert tied to meaningful participation for the instrument and session period. The correct threshold depends on contract liquidity, bar construction, and the time of day. The ES during the opening rotation does not print like a slower midday auction, and a fixed threshold may be too permissive in one condition and too restrictive in another.
Finally, decide whether the event must occur on a developing bar or only after bar completion. Developing-bar alerts are faster, but they can produce more temporary events as volume continues to accumulate. Completed-bar alerts are more stable, but the information arrives later. Neither is universally better. The choice should match whether you are monitoring immediate auction behavior or cataloging finished structure.
Configure Alert Priorities, Not Alert Clutter
The fastest way to make an alert system unusable is to assign the same priority to every footprint feature. During an active futures session, individual imbalances, delta changes, and price-level volume events can occur continuously. If all receive an audio notification, the audio becomes background noise.
A practical hierarchy has three layers. First, use visual highlighting for routine conditions that should remain on the chart without interrupting attention. Second, use a distinct sound for high-conviction structural events, such as a configured stacked imbalance at a key profile reference. Third, reserve text-to-speech for the few conditions that must be recognized without looking directly at the chart.
Text-to-speech works best when the spoken message is short and unambiguous. State the instrument, event, and location reference if needed. A phrase such as “ES stacked ask imbalance at prior value high” communicates more than a generic alert tone, particularly when several workspaces are open. Long spoken descriptions arrive too late to be useful and compete with the next developing event.
Visual differentiation matters just as much. Give absorption, exhaustion, and stacked imbalance events separate colors and marker styles. Use colors that remain legible against your footprint color map, delta shading, and volume-profile columns. A visual alert that blends into high-volume cell coloring is functionally absent.
Absorption and Exhaustion Need Context
Absorption is among the most valuable conditions to monitor because it exposes a mismatch between aggressive volume and price progress. Heavy ask activity may transact at an upper extreme while price cannot continue higher. Heavy bid activity may transact at a lower extreme while price cannot continue lower. The defining feature is not volume alone. It is volume meeting a passive response that limits extension.
Configure absorption around both a volume threshold and a location rule. An absorption event in the middle of a broad, rotational area carries different information from one at a session extreme, a prior VPOC, or the edge of value. When possible, keep the footprint, session profile, and reference levels visible in the same chart panel or tightly aligned panels. The alert identifies the event; the layout explains its relevance.
Exhaustion is different. It often appears as reduced participation at an auction extreme after a directional sequence. The footprint may show low volume or a sharp thinning of prints near the edge. An exhaustion alert is most useful when it is measured against recent activity rather than viewed as an isolated small print. Session tempo matters. What qualifies as thin at 9:35 a.m. Eastern may be ordinary at midday.
SidiFootprint supports configurable absorption and exhaustion detection alongside footprint and profile analytics, allowing these conditions to be monitored without splitting the order-flow view into separate tools. That consolidation is useful only when the settings remain disciplined. More configuration options create control, but they also require deliberate standardization.
Use Profile References to Filter Events
Order flow has more meaning when it occurs at a known auction reference. VPOC, developing VPOC, value-area high, value-area low, prior session extremes, and low-volume areas provide the structural map for interpreting a footprint event.
Consider a stacked imbalance appearing at a developing VPOC. It may indicate acceptance and continued two-way trade around the session's most active price. The same stack appearing through a low-volume area may reflect a fast auction seeking the next area of participation. The footprint pattern may look identical in isolation, while the profile location changes the read entirely.
For this reason, alerts should include proximity logic when your workflow supports it. Rather than notifying on every imbalance, focus on events occurring within a defined number of ticks from a profile reference or session boundary. This reduces repetitive notifications and forces each alert to answer a useful question: what traded here, and where is here within the auction?
Dual profile columns can help separate developing-session information from a fixed reference profile. One column can display the active session's developing VPOC and value area while another retains an anchored or prior-session profile. When an alert fires, the trader can compare immediate participation with the larger distribution without changing studies or moving to another chart.
Test Alerts Under Real Market Tempo
An alert configuration that looks clean in historical replay may behave differently during live market speed. Test it across opening activity, scheduled economic releases, rotational midday periods, and late-session movement. Watch not only whether the condition fires, but how often it fires, whether the visual marker remains readable, and whether the audio is distinguishable from other platform notifications.
Review false clutter as a configuration problem, not as a reason to abandon the condition. Raise the minimum volume, tighten the imbalance ratio, require additional stacked levels, limit the event to a session window, or add a location filter. If a meaningful event is consistently missed, relax one variable at a time. Changing every setting at once makes it impossible to identify what improved the behavior.
Keep a stable baseline template for each instrument and bar type. A 30-minute footprint, a range-based footprint, and a fast tick chart should not necessarily share thresholds. Their aggregation changes the way volume and delta accumulate. Versioned templates preserve consistency while allowing controlled experimentation.
The best order-flow alert setup is quiet until the auction reaches a condition worth seeing. When that condition appears, the notification should be specific enough to direct your eyes to the correct price level, and your chart should already contain the footprint and profile context needed to read what actually traded there.
See it on your own chart.
Every Sidi tool is unlocked in the free 14-day demo. Install SidiFootprint in NinjaTrader 8 and load one of the finished color styles to start.
Start free 14-day demo → SidiFootprint features Browse color stylesRelated articles
NinjaTrader Indicators for Order Flow Control
NinjaTrader indicators turn bid/ask activity into real-time chart context. Configure footprint, profile, delta, and alerts for active futures markets.

NinjaTrader 8 Footprint Chart for Faster Reads
Build a NinjaTrader 8 footprint chart that exposes delta, imbalances, absorption, VPOC, and auction context when futures order flow accelerates fast.
Futures Order Flow Visualization Guide for E-mini
Use this futures order flow visualization guide to configure footprint, delta, VPOC, profiles, and imbalance context for fast E-mini auctions each day.