
Top Footprint Visualization Settings for Fast Tape
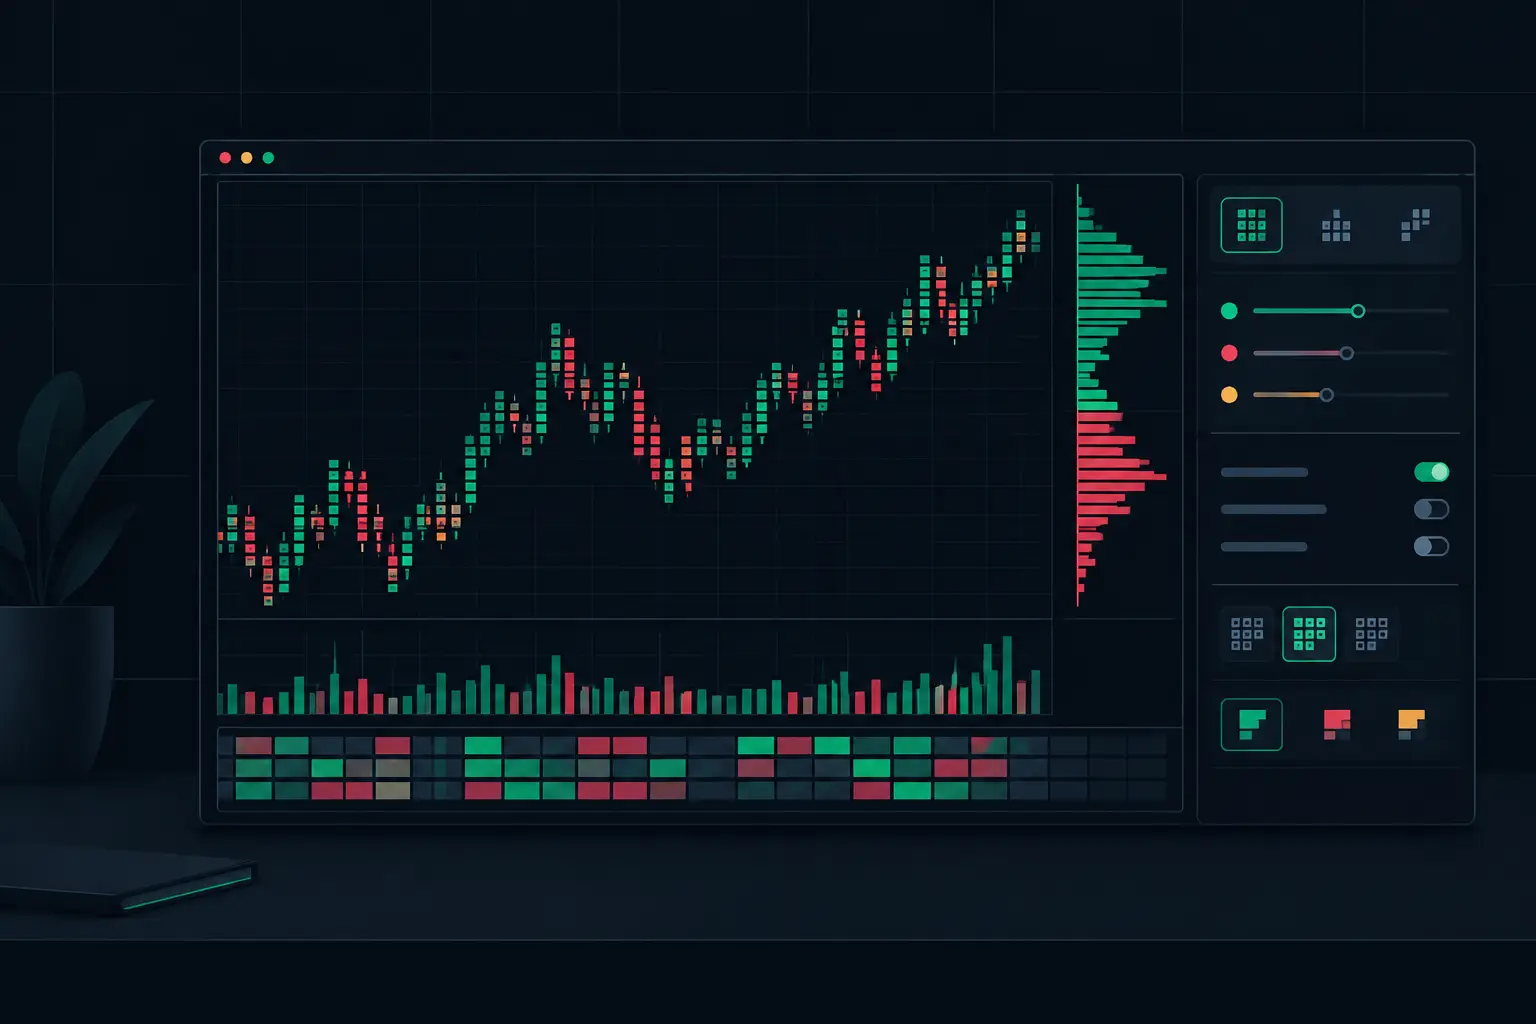
A footprint chart can show every bid and ask transaction at the price level, yet still become unreadable when the tape accelerates. The top footprint visualization settings are not the ones that place the most data on screen. They are the settings that make initiative activity, passive response, acceptance, and rejection visible without forcing your eyes to decode a wall of numbers.
For active futures traders, the layout must hold together during developing bars, range expansion, and rotational auction. That requires deliberate control of cell content, color hierarchy, imbalance logic, profile placement, and text density. SidiFootprint provides more than 1,000 configuration options because no two order-flow workflows require the same visual priority. The goal is not maximum configuration. The goal is a chart where the information that matters is obvious at a glance.
Start With the Information Layer
Before changing colors or thresholds, decide what each footprint cell must communicate. Bid x ask volume is the standard starting point because it exposes aggressive selling at the bid and aggressive buying at the ask at every price. It is direct, compact, and effective when read beside bar structure and profile context.
Delta can be more useful when the question is whether one side is controlling a developing auction across the bar. Volume and trade count answer different questions. A large volume figure may result from a few large executions or a dense sequence of smaller transactions. Keeping trade count available can separate those conditions when participation quality matters.
Do not load bid x ask, delta, volume, trades, percentage delta, and cumulative delta into every cell simply because they are available. Multiple values reduce whitespace, shrink the numerals, and weaken scan speed. Use one primary cell format, then place secondary context in a profile column, summary area, or a separate chart panel. A footprint should let you follow price first and inspect detail second.
Use Delta as Context, Not Decoration
Bar delta and cumulative delta are most useful when their placement supports the way you read the auction. A bar-level delta display can show whether aggressive volume is concentrated within the current bar. Cumulative delta provides a broader running measure of aggression through the session or chosen reset period.
The useful setting is not merely showing cumulative delta. It is defining its reset behavior and ensuring its visual location does not compete with the footprint itself. Session-based context may suit intraday auction work, while a custom reset can isolate a specific opening sequence or market segment. The correct choice depends on the reference period being studied.
Top Footprint Visualization Settings: Color Hierarchy
Color should classify exceptional behavior, not paint every number. If ordinary bid and ask cells are already saturated, a meaningful imbalance or absorption event has no room to stand out. Keep baseline text neutral or lightly differentiated, then reserve stronger color for conditions that require immediate attention.
A practical hierarchy uses muted colors for normal executed volume, stronger directional colors for delta extremes or imbalances, and a separate high-contrast treatment for VPOC. This prevents the eye from confusing the most traded price with the most aggressive price. Those are frequently different locations, and the distinction matters.
Set minimum and maximum volume ranges with the instrument and bar aggregation in mind. A threshold that works on a 2,000-volume ES chart may be visually meaningless on a faster aggregation. Static thresholds can work during stable conditions, but relative coloring or graduated color intensity often adapts better when session participation changes materially.
Avoid rainbow palettes. Four or five competing colors turn a footprint into a heat map with no clear reading order. Directional aggression, value references, VPOC, and alerts should each have a distinct visual role. If two conditions use similar colors, they will eventually be mistaken for one another when the market is moving quickly.
Separate VPOC From Imbalance Color
The VPOC identifies the price with the highest volume within the selected bar or profile calculation. It is a volume-location reference, not proof of directional control. Give it a dedicated color or marker style that remains visible beneath other formatting rules.
This becomes especially important when a high-volume VPOC overlaps an imbalance. The chart should show both facts: aggressive execution occurred at the location, and that location attracted the largest volume. A formatting priority that lets one erase the other removes useful auction detail.
Set Imbalance Logic Around the Instrument
Diagonal imbalance settings are central to footprint readability. A diagonal ask imbalance compares ask volume at one price with bid volume one tick below. A diagonal bid imbalance compares bid volume at one price with ask volume one tick above. This comparison follows the ladder and exposes unequal aggressive participation across adjacent price levels.
The ratio and minimum-volume filters must work together. A high ratio with no minimum filter can highlight trivial 1-by-5 comparisons. A heavy minimum-volume filter can hide meaningful activity during quieter periods. There is no universal number because the correct threshold depends on the instrument, time of day, chart aggregation, and current participation.
Start by requiring enough volume for a highlighted condition to be structurally meaningful, then adjust the ratio until ordinary two-way activity remains mostly uncolored. The chart should emphasize genuinely one-sided execution, not label every active price level. Review several complete sessions before treating a setting as stable.
Stacked imbalance settings need the same discipline. Define the number of consecutive qualifying price levels required to mark a stack, then choose whether adjacent stacks should be extended or treated as separate events. A three-level stack may be useful in a tight ES rotation; a larger requirement can reduce noise on faster, wider bars. The right setting is the one that preserves the structure you actually intend to study.
Keep Profiles Independent From the Footprint
A single footprint column answers what traded at each price inside the bar. Profile columns answer how volume or delta distributed through that bar, session, or selected range. Mixing those jobs inside one visual layer makes both harder to read.
Use the independent profile columns to preserve context without widening each footprint cell. A volume profile can show where participation accumulated. A delta profile can show where aggressive buying or selling concentrated. Placing them side by side is useful when large volume and strong delta do not occur at the same prices.
Value area settings deserve the same precision. The chosen value-area percentage controls how much of the distribution is treated as accepted volume. A conventional setting is often a useful baseline, but the display should remain subordinate to the actual shape of the profile. A balanced distribution, a double distribution, and a thin directional profile should not be made to look alike through overly heavy shading.
For session profiles, make the opening and closing times explicit. Overnight activity, regular trading hours, and custom segments create different volume distributions. If the session boundary does not match the auction period under review, VPOC and value-area references can become visually accurate but analytically misplaced.
Make Developing Bars Readable
Developing-bar settings determine whether the chart remains useful before a bar closes. Live updating of bid x ask, delta, VPOC, imbalances, and profile values lets you observe the auction forming instead of waiting for a completed print.
That visibility creates a trade-off. Developing values can change as new execution arrives. A VPOC can migrate, an imbalance can appear or disappear around a filter boundary, and a profile shape can expand. Use formatting that clearly distinguishes developing references from completed-bar references when both are displayed. A lighter shade, alternate line style, or dedicated marker prevents temporary structure from being confused with final structure.
Absorption and exhaustion detection should also be tuned for visibility rather than frequency. Absorption is most useful when aggressive volume meets passive liquidity without proportional price progress. Exhaustion is most useful when activity fades at an auction extreme. If their thresholds are too loose, the chart produces constant markings that obscure the very events they are meant to isolate.
Protect Screen Space and Execution Speed
The fastest layout is usually the one with fewer competing elements. Reduce font size only after removing data that does not support the current read. If bid x ask values cannot be read comfortably at the chart scale, the footprint is too dense for the display area.
Use row height and tick compression carefully. More price levels per bar can provide context, but excessive compression makes diagonal comparisons slow and weakens imbalance visibility. One-tick precision remains essential when the objective is to inspect exact execution, while aggregated rows can help when the priority is broader distribution shape. These are different views, not interchangeable settings.
Maintain a stable template for each instrument and aggregation, then alter only the variables tied to market pace: color range, imbalance minimums, profile width, and developing-bar emphasis. Constantly rebuilding the chart during active conditions defeats the purpose of a configurable footprint.
The best footprint layout does not announce every transaction. It gives VPOC, stacked imbalances, delta concentration, absorption, and profile structure enough separation that the auction can be read before the next bar changes the picture.
See it on your own chart.
Every Sidi tool is unlocked in the free 14-day demo. Install SidiFootprint in NinjaTrader 8 and load one of the finished color styles to start.
Start free 14-day demo → SidiFootprint features Browse color stylesRelated articles
Futures Order Flow Visualization Guide for E-mini
Use this futures order flow visualization guide to configure footprint, delta, VPOC, profiles, and imbalance context for fast E-mini auctions each day.
How to Set Footprint Imbalance Thresholds
Learn how to set footprint imbalance thresholds that expose meaningful aggression, filter routine prints, and preserve auction context on fast markets.
E-mini Bid Ask Visualization That Holds Up
See E-mini bid ask visualization at each price level, with footprint, delta, imbalances, VPOC, and profiles built for fast NinjaTrader 8 charts in motion.