
Reading POC Migration Charts in Futures Markets
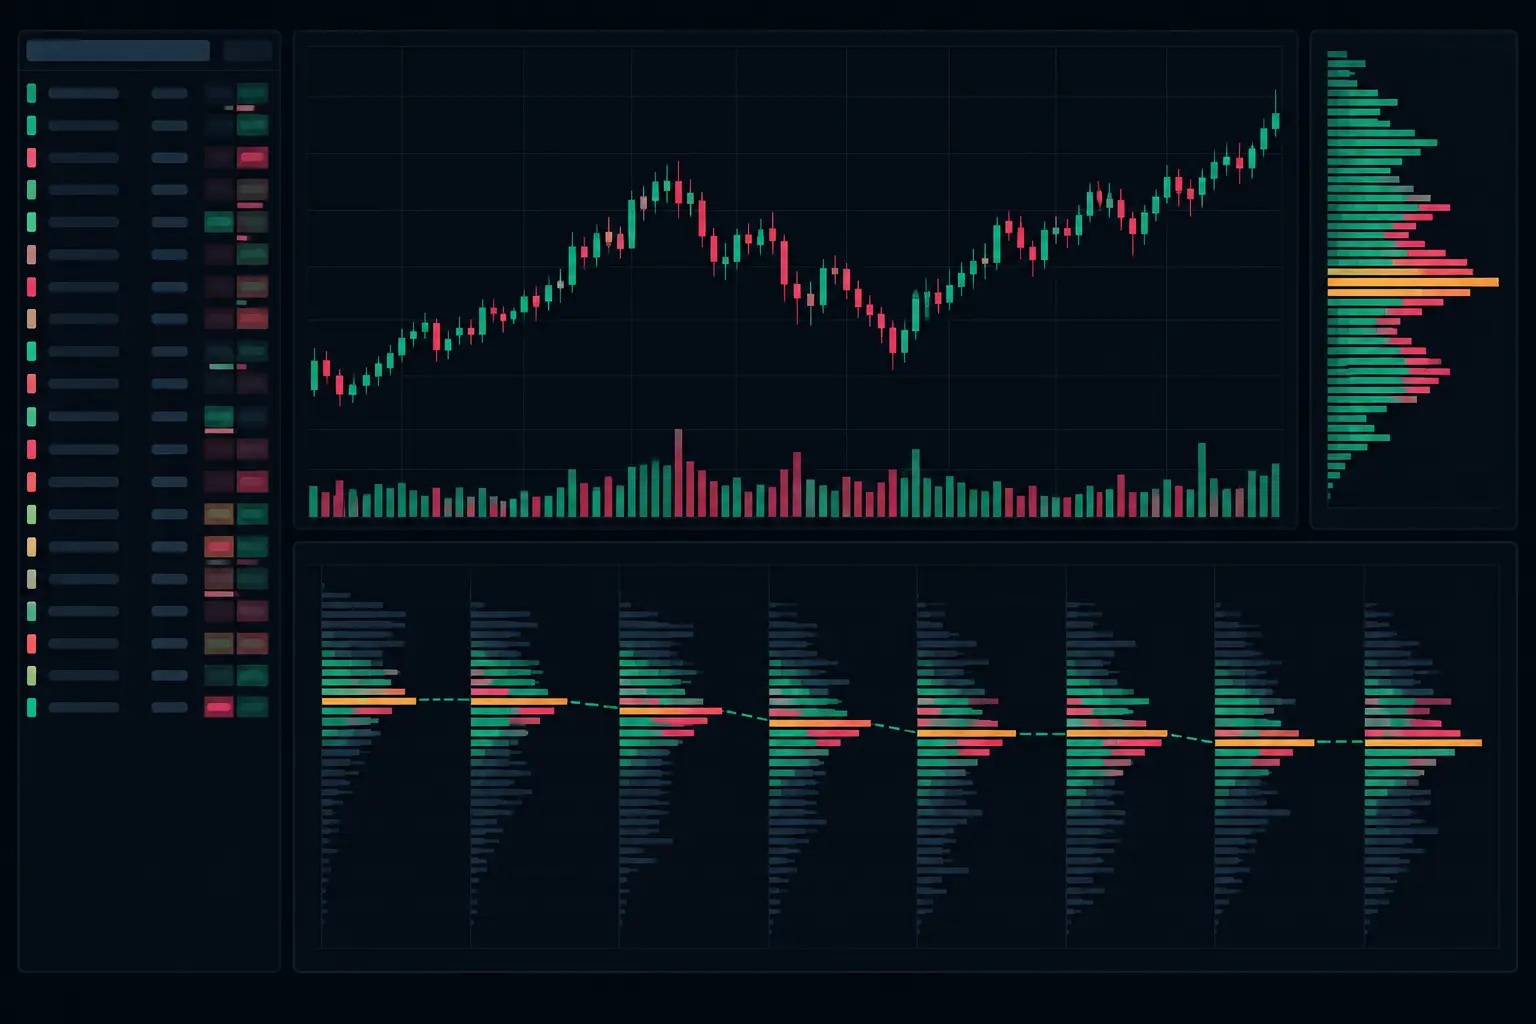
A POC that moves is not just a changing label on a profile. Reading POC migration charts means tracking where the market is doing business now versus where it previously found acceptance. On an active futures chart, that shift can clarify whether an auction is building higher, relocating lower, or rotating around the same accepted price.
Most traders see a moving candle and infer direction. Order-flow traders can inspect the volume distribution underneath it. The point of control - the price with the greatest traded volume in a defined profile - becomes useful when its movement is read alongside value area development, delta, imbalances, and the structure of the developing auction.
What POC migration actually measures
A volume profile is a record of where contracts traded at each price. Its VPOC identifies the price with the highest volume for the selected range, whether that range is a session, a custom profile, or a developing intraday segment. POC migration describes a meaningful relocation of that highest-volume price over time.
The distinction matters. A price can print above the current VPOC without moving acceptance. If volume remains concentrated lower, the auction may simply be probing above value. Conversely, when volume begins accumulating and holding at higher prices, the VPOC can lift with the distribution. That is a change in where participation is being accepted, not merely a price excursion.
Read migration as a sequence, not as a single event. One VPOC shift can result from a brief burst of activity. Repeated shifts in the same direction, especially when value area boundaries relocate with them, describe a more organized change in the auction.
Reading POC migration charts with auction context
A POC has no fixed meaning outside its profile definition. A developing session VPOC, a completed session VPOC, and a composite VPOC answer different questions. The first shows where the current session is concentrating volume. The second marks the session's final center of activity. The composite identifies acceptance across a broader auction.
Higher POC migration
When the developing VPOC steps higher, first determine whether price is building volume above the prior value area or merely passing through it. A higher POC with a higher developing value area suggests that activity is relocating upward. The profile often develops a shelf at each newly accepted level, while the previous POC becomes a reference below.
The footprint should support the profile reading. Look for sustained ask-side participation at the prices where the new distribution forms, not only at the highest traded prices. Stacked ask imbalances, positive delta that persists through multiple price levels, and responsive volume at pullbacks can show that the upper area is attracting continued activity.
Do not confuse aggressive buying with acceptance automatically. Large ask volume at an extreme can also meet passive supply. If the footprint shows heavy positive delta but price stops extending, with repeated volume accumulating at the same ceiling, the chart may be showing absorption rather than a clean upward migration. The profile tells you where volume built. The footprint explains how that volume was transacted.
Lower POC migration
Lower POC migration follows the same logic in reverse. The relevant question is not whether price traded below the old VPOC. It is whether the market has transferred enough volume below it to establish a new center of activity.
A developing VPOC that descends while value area expands lower indicates that the lower auction is gaining acceptance. Consecutive bid-side imbalances, sustained negative delta, and volume shelves forming beneath prior value can reinforce that reading. If price returns to the old VPOC and finds little volume or immediate rejection, the prior center may now function as an overhead reference rather than the active center of the session.
Again, context decides the interpretation. Heavy bid volume near a low that fails to extend can indicate aggressive sellers being absorbed by resting demand. In that case, the lower print may be a terminal test rather than the beginning of a lower accepted distribution.
Stable POC during price movement
A stationary VPOC can be more informative than a moving one. When price travels away from the POC but the largest volume node remains fixed, the market has not yet moved its primary acceptance. This often occurs during extensions that have not built enough two-way activity to relocate the profile.
If price later returns to that stable POC, inspect how it trades there. Fast traversal through the level suggests the market is not pausing to rebuild acceptance. Slower, high-volume interaction with balanced delta suggests the original center is still active. A stable POC is not a directional reference by itself. It is a location where the auction previously concentrated participation and may do so again.
Separate migration from ordinary profile rotation
Rotational sessions can produce frequent POC changes that have little structural weight. In a narrow range, a few hundred contracts at one nearby price can move the developing VPOC by a tick or two, then move it back. Treating every update as meaningful creates noise, especially in instruments with dense intraday volume.
The useful question is whether the shift changes the profile structure. Compare the new POC to the prior POC, the value area, and visible high-volume nodes. A one-tick relocation inside an established balance is different from a move that carries the POC through a value-area edge and begins building a new distribution.
Time matters as well. A VPOC that holds at its new level through several developing bars carries more information than one that flashes there briefly. The same applies to volume. A relocated POC supported by a broad shelf has a different character from a thin, isolated print created during a rapid push.
Use delta and imbalances to qualify the shift
POC migration is volume-location analysis. Delta and imbalances add the aggressor side of the transaction. Neither replaces the other.
Suppose the E-mini S&P 500 futures session develops a higher VPOC. If that relocation coincides with repeated diagonal ask imbalances and expanding positive cumulative delta, aggressive buyers are clearly participating at the new area. But if the same positive delta prints against little upward price progress, passive offers may be absorbing the activity. The developing profile may still migrate, yet the quality of the auction is different.
The most useful confirmation is alignment between location, participation, and response. Location is the new POC and value area. Participation is bid/ask volume, delta, and stacked imbalances. Response is whether price can continue auctioning away from the old center or returns to it. When those three elements disagree, reduce the certainty assigned to any single chart feature.
Exhaustion also matters near the edge of a migration. If a higher POC forms but the final extension shows thinning ask volume, reduced trade count, or a visible exhaustion pattern, the market may be losing urgency after establishing a new value zone. That is not a forecast. It is a change in the quality of participation that belongs on the chart.
Configure the chart so migration remains visible
POC migration is easiest to read when profile boundaries and footprint data are not competing for space. Use a developing session profile when the immediate auction is the focus, then retain prior session profiles or their VPOCs as separate historical references. A composite profile can provide the larger acceptance structure without obscuring the active session.
Color hierarchy should be strict. Make the developing VPOC visually distinct from completed VPOCs, and keep value-area shading subordinate to the POC line. If multiple profiles overlap, label their source clearly: session, custom range, or composite. A chart that forces you to decode line colors during fast tape is poorly configured.
SidiFootprint can place dual independent profile columns beside the footprint while preserving bid/ask detail at each price. That layout is particularly useful when comparing an active developing profile with a broader composite. One column shows where the current session is relocating volume; the other shows whether that relocation is occurring inside or outside the larger accepted structure.
Avoid profile settings that are too coarse for the instrument's active range. Excessive row aggregation can hide a gradual POC stair-step by combining distinct price levels into one block. Settings that are too fine can overemphasize minor migration inside a tight rotation. The correct resolution depends on tick size, intraday volatility, and the time horizon being analyzed.
A practical reading sequence
Before reacting to a moved POC, establish the profile type and the time window it represents. Then identify whether the new POC is still inside prior value, at its edge, or clearly outside it. Inspect whether value area is moving with the POC, and whether the new location is developing a broad volume shelf or a narrow spike.
Next, read the footprint at the new location. Check whether aggressive activity is persistent, whether it is being absorbed, and whether price responds with continued auctioning or immediate rotation. Finally, keep the prior POC visible. The distance and interaction between old and new centers often show more than either line alone.
The chart becomes clearer when a POC is treated as an evolving record of acceptance rather than a static horizontal level. Let the profile show where volume relocates, then let the footprint show what actually traded while that relocation occurred.
See it on your own chart.
Every Sidi tool is unlocked in the free 14-day demo. Install SidiFootprint in NinjaTrader 8 and load one of the finished color styles to start.
Start free 14-day demo → SidiFootprint features Browse color stylesRelated articles
Futures Auction Analytics at Each Price Level
Futures auction analytics reveals the bid/ask interaction, delta, volume, and acceptance behind every developing futures auction in real time as it forms.
Order Flow Scalping for Fast Futures Markets
Order flow scalping reads executed volume, delta, liquidity, and response at each price so futures traders can frame fast intraday auctions with precision.
Volume Profile Software for Fast Futures Charts
Volume profile software maps traded volume by price, giving active futures traders developing VPOC, value areas, and session context in real time daily.