
Value Area Migration Trading on Footprint Charts
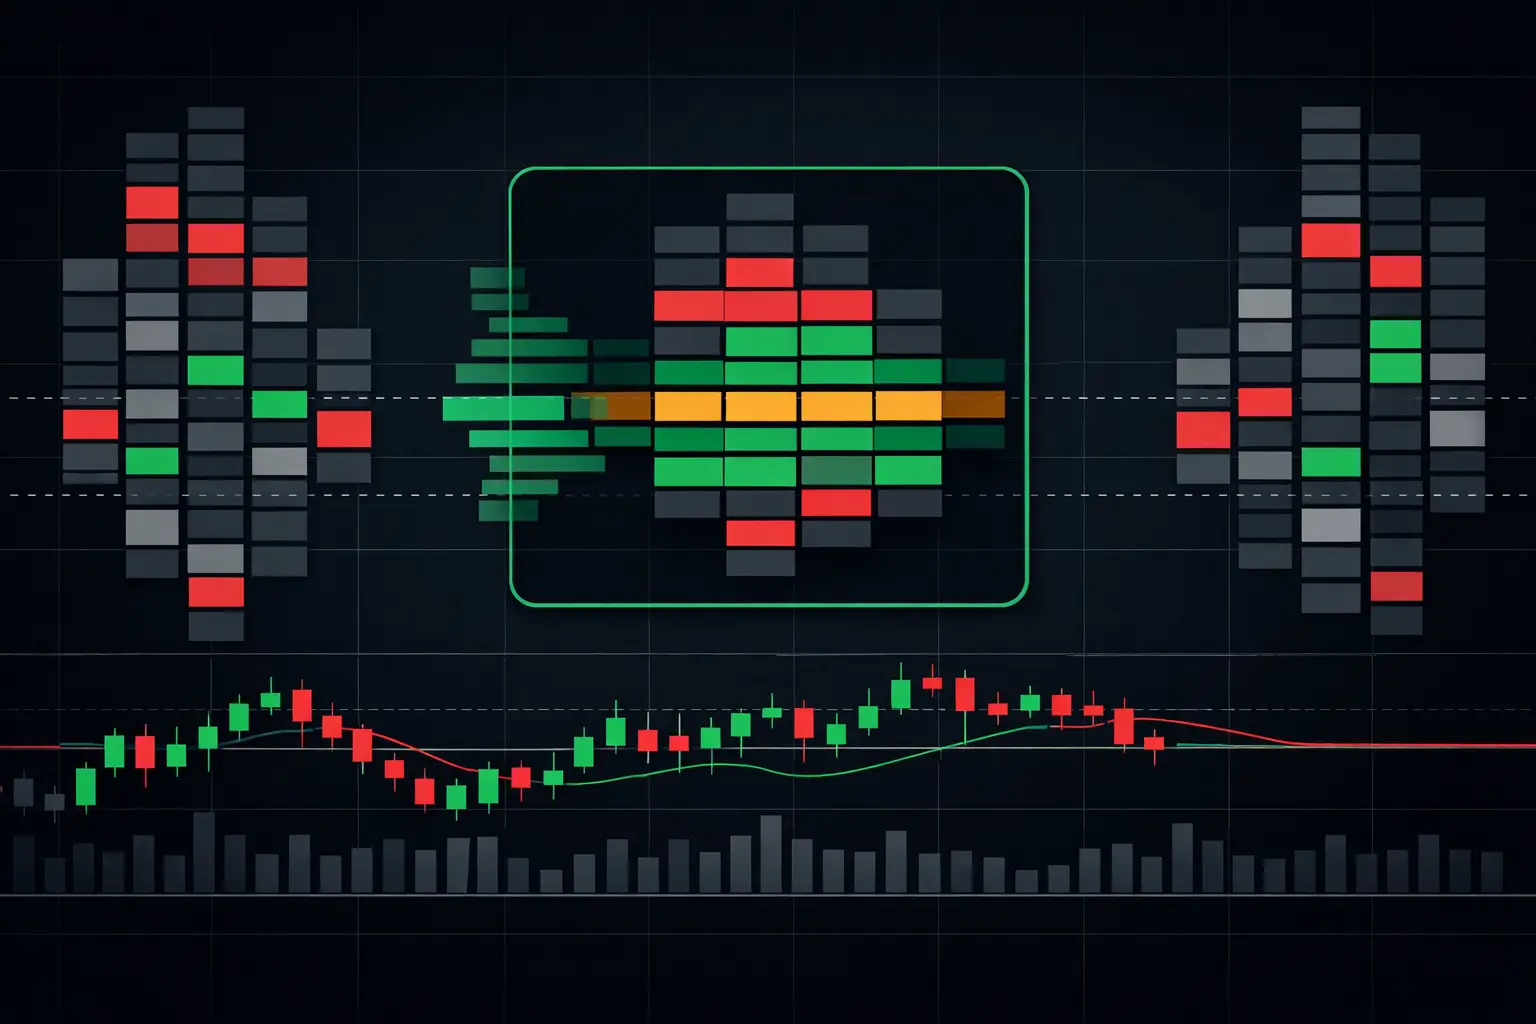
A value area that relocates is not a cosmetic profile change. It is evidence that the auction may be conducting business at a new set of prices. Value area migration trading turns that relocation into a structured read of acceptance, initiative activity, and the quality of the move. Candles show where price closed. A developing profile and footprint show whether two-sided volume actually accumulated there.
For active futures traders, the distinction matters most when the tape accelerates away from a prior balance. Price can probe beyond value in seconds. The useful question is not whether it traded outside the range, but whether volume, VPOC, delta, and repeated participation begin building a new area of acceptance.
What Value Area Migration Actually Measures
A session profile organizes traded volume by price. The value area commonly contains the prices that held roughly 70% of the session's volume, centered around the VPOC, or Volume Point of Control. When tomorrow's developing value area forms materially higher or lower than the prior session's area, the market is no longer distributing volume around the same reference prices.
That is migration. Higher value suggests acceptance is developing above prior value. Lower value suggests acceptance is developing below it. Overlapping value suggests the auction is still negotiating the same general location, even if the intraday range has expanded well beyond it.
The important word is acceptance. A thin excursion above a prior value-area high is not automatically higher value. It may be a responsive probe that finds no sustained participation. Likewise, an initial move below value can reverse sharply if aggressive sellers meet passive demand and the developing VPOC rotates back toward the prior range.
Value area migration trading therefore requires more than comparing two shaded areas. It requires observing how the new profile develops while price interacts with the old one.
Read the Migration as an Auction, Not a Static Level
Start with the relationship between the current developing value area and the completed prior-session profile. There are three broad structures worth separating.
Higher or Lower Value With Separation
When the full developing value area is forming above the prior value-area high, or below the prior value-area low, the profile shows clear separation. The market is allocating volume in fresh territory rather than repeatedly rotating through the previous value.
Separation carries more weight when the developing VPOC also holds outside prior value. A VPOC that remains above the prior value-area high through repeated rotations is a stronger structural observation than a brief print above that level. The same logic applies below prior value.
Still, separation alone does not describe who is participating. A higher profile can form on weak, thin trade and remain vulnerable to rotation. Footprint data provides the required layer of detail.
Overlapping Value With a Shifted VPOC
Value areas can overlap substantially while the VPOC migrates. This is a transitional condition. The auction still recognizes much of the old range, but its heaviest volume is beginning to concentrate at a different price.
This structure often appears during rotational sessions or during the first phase of a directional auction. Do not force it into a binary higher-value or lower-value label. Track whether each developing bar reinforces the VPOC shift, whether volume continues to build around it, and whether price can hold there after revisiting the reference.
Failed Migration Back Into Prior Value
A move outside value becomes less convincing when price quickly returns, the developing VPOC rotates inward, and volume begins accumulating back in the old distribution. That sequence describes rejection of the attempted location, not sustained acceptance beyond it.
The footprint can make the failure visible before the profile is complete. For example, selling may extend below prior value with large negative delta, yet repeated absorption at the lows prevents further displacement. If the next rotations rebuild volume inside prior value, the profile is documenting a failed lower migration.
Use Footprint Data to Qualify the New Value Area
A profile answers where business concentrated. Footprint charts explain how business was conducted at each price. Combining both prevents a common error: treating every profile shift as equivalent.
At the boundary of prior value, inspect the bid and ask activity that created the break. Initiative buying above a value-area high may appear as stacked ask-side imbalances, positive delta expansion, and volume continuing to print at higher prices. Initiative selling below a value-area low may show the inverse: stacked bid-side imbalances, negative delta, and continued volume acceptance beneath the old area.
But aggressive activity alone is not enough. Large market orders can be absorbed. If buy volume repeatedly lifts the offer at a high price while price stops advancing, passive sellers may be containing the auction. If that absorption is followed by a rotation back into prior value, the apparent upside expansion did not establish a durable new distribution.
The same principle applies on the downside. Heavy selling at the bid near a low can look forceful on a delta column. When price refuses to extend and the footprint shows repeated volume trading at the same low, passive demand may be absorbing that pressure. A developing profile that then pulls its VPOC upward gives that absorption structural context.
SidiFootprint is built for this combined read. Its footprint cells, delta, diagonal imbalances, VPOC, value areas, and dual independent profile columns can remain visible in one NinjaTrader 8 layout. That matters when a developing auction must be read without switching between disconnected studies while price is moving quickly.
A Practical Value Area Migration Workflow
Before the active session, mark the prior session's VPOC, value-area high, and value-area low. These are not isolated horizontal lines. Together, they define the prior accepted distribution and give the current session a precise reference.
As the new session develops, first classify location. Is the developing profile being built inside prior value, overlapping one edge, or clearly outside it? Next, compare the current VPOC with the old VPOC. A migrating VPOC often provides a cleaner read than a momentary range extension.
Then inspect the footprint at the transition point. Look for whether imbalances are stacked and continuing, whether delta expands with price displacement, and whether the activity receives follow-through at subsequent price levels. When volume is concentrated at one extreme but price cannot continue, turn attention to absorption and exhaustion instead of assuming that the aggressive side remains in control.
Finally, monitor the developing bars after the initial displacement. A new value area is built through repeated trade, not declared by the first print outside an old boundary. If the developing value area widens and volume keeps collecting around the shifted VPOC, the profile is becoming more established. If it contracts back toward old value, the market is re-auctioning the prior distribution.
Configuration Details That Improve the Read
The profile must be configured at a granularity appropriate to the instrument and session structure. On E-mini S&P 500 futures, a profile that is too compressed can hide important intraday volume shelves. A profile that is too granular can turn ordinary variation into visual noise. The correct balance depends on whether the chart is being used for short rotations, broader session structure, or multi-session context.
Keep the value-area percentage consistent when comparing adjacent sessions. Changing that percentage changes the width of the area and weakens direct comparison. Also keep session templates consistent. A regular trading hours profile and an extended-hours profile answer different questions because they include different auctions.
Use separate profile columns when possible. One can display the completed prior session while the other develops in real time. This removes the mental reconstruction required when old and current volume distributions occupy the same column. Color settings should also emphasize structure rather than decoration: make VPOC, value-area boundaries, stacked imbalances, and absorption conditions immediately distinguishable.
Alerts can be useful for drawing attention to a developing VPOC shift, a value-area boundary interaction, or a stacked-imbalance sequence. The chart still requires context. An alert identifies an event; the profile and footprint show whether the event is building acceptance or being absorbed.
Keep the Read Conditional
Value migration is strongest when multiple elements agree: the developing value area relocates, VPOC holds in the new location, volume builds there, and footprint participation supports continued acceptance. When those elements conflict, the correct read is often unresolved auction behavior, not certainty.
Treat the prior value area as a live reference until the new one has actually developed. Watch the VPOC, watch where volume stays, and watch whether aggressive activity displaces price or gets absorbed. The chart will show the difference between a fast excursion and a market that has genuinely changed where it does business.
See it on your own chart.
Every Sidi tool is unlocked in the free 14-day demo. Install SidiFootprint in NinjaTrader 8 and load one of the finished color styles to start.
Start free 14-day demo → SidiFootprint features Browse color stylesRelated articles
Session Volume Profile NinjaTrader Setup
Configure a session volume profile in NinjaTrader 8 to track VPOC, value area, developing distribution, and order flow at every price level with precision.
E-mini Bid Ask Visualization That Holds Up
See E-mini bid ask visualization at each price level, with footprint, delta, imbalances, VPOC, and profiles built for fast NinjaTrader 8 charts in motion.
High Volatility Order Flow Example Explained
A high volatility order flow example shows how delta, stacked imbalances, absorption, and VPOC expose the auction when price accelerates across the range.