
Draw the trade. Read the result.
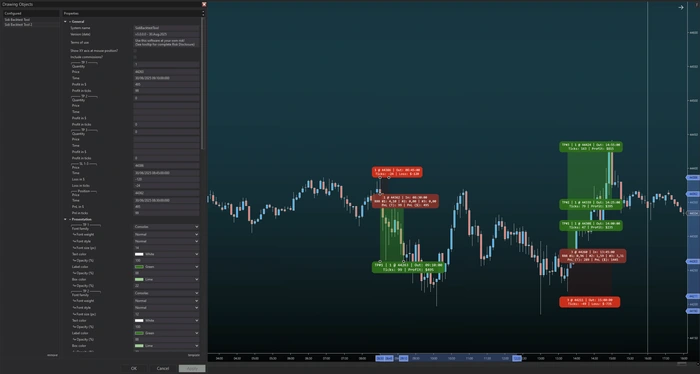
Discretionary testing usually means a spreadsheet next to the chart and a lot of typing. SidiBacktestTool keeps it in the chart: draw entry, stop and up to three targets, see the box appear with the numbers already in it, and export the lot as CSV when you are done.
What it puts on your chart
There are two honest ways to find out whether an approach holds up. One is to code it and run it over history, which works when the approach can be written down as rules. The other is to go through past sessions bar by bar and mark what you would have done, which is the only option when the approach lives partly in judgement.
The second way usually breaks on bookkeeping. Entry, stop, three targets, partial sizes, the time of each exit, the result in ticks and in currency, and all of it typed into a spreadsheet by hand while the chart sits in another window. Most people stop after twenty trades, which is well short of telling you anything.
SidiBacktestTool does the bookkeeping. You draw the trade into the chart, it becomes a coloured box with the numbers already in it, and when the session review is over, one click writes every trade on the chart into a CSV file. The analysis happens where it belongs, in a spreadsheet, on data that did not have to be typed.
Every trade in one table, one click away
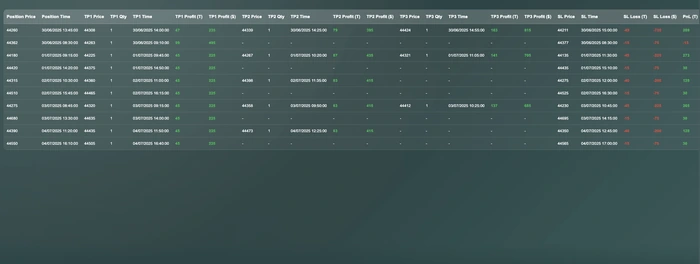
A drawn trade is not worth much if it stays in the chart. The export writes every trade on the chart into a CSV file, one row each, with up to twenty columns: entry price and time, stop price, time and result, and price, quantity, time and result for each of the three targets on its own. That is a file Excel, Google Sheets or anything else can read the moment the session is over.
What you can change.
What the tool can do, block by block.
Drawing a trade
- Long and short trades
- Entry price and entry time
- Stop level
- Up to three targets, each with its own price, time and quantity
- Drawn as one object in the chart, moved and adjusted afterwards
What is computed
- Outcome per target, in ticks and in currency
- Risk to reward ratio of the drawn trade
- Entry and exit times and prices
- Colour coding of the box by outcome
Export
- Every trade on the chart written to a CSV file in one click
- Up to twenty configurable columns
- Target price, quantity, time and result kept separately per target
- Stop price, time and result in their own columns
- Readable in Excel, Google Sheets and anything else that takes CSV
Appearance
- Separate colours and opacity for entry, stop and each of the three targets
- Own font, font size and colour per element
- Labels configurable one by one
- Optional display when hovering the axes
One trade, five prices, three partial exits
A trade is drawn as one object, and the object carries everything about it. The box in the chart is coloured by outcome and labelled with the numbers, so reading back through a session is a matter of scrolling, not of cross-referencing a spreadsheet.
What you draw
- Entry price and time
- Stop price
- Target 1
- Target 2
- Target 3
- Quantity per target, for partial exits
What the box shows
- Outcome in ticks and in currency
- Risk to reward ratio
- Entry and exit times
- Entry and exit prices
- Colour coding by outcome
- Own colours, opacity and font sizes per element
Built for reviewing, not for coding
Nothing here has to be programmed. You draw what you would have done, the tool works out what it would have come to, and the box stays in the chart as a record. That makes it useful for three things: testing a discretionary approach over past sessions, going back through trades you actually took, and showing someone else what happened on a specific bar.
The drawn trades belong to the chart they were drawn on. Export them before you rebuild the chart if you want to keep them.
Pick your licence.
Every plan includes free updates. Secure checkout handled by Freemius.
One licence, any of your computers
The licence is tied to your email address, not to a machine ID. You can install SidiBacktestTool on as many computers as you like and run it on one of them at a time.
Before you install.
Q · 01Is this an automated backtester?+
Q · 02Can I model partial exits?+
Q · 03What ends up in the CSV?+
Q · 04Do I need to write any code?+
Q · 05Which NinjaTrader version does it need?+
Q · 06What do I get in the free demo?+
Read more
Order Flow Indicator Free Trial for NinjaTrader 8
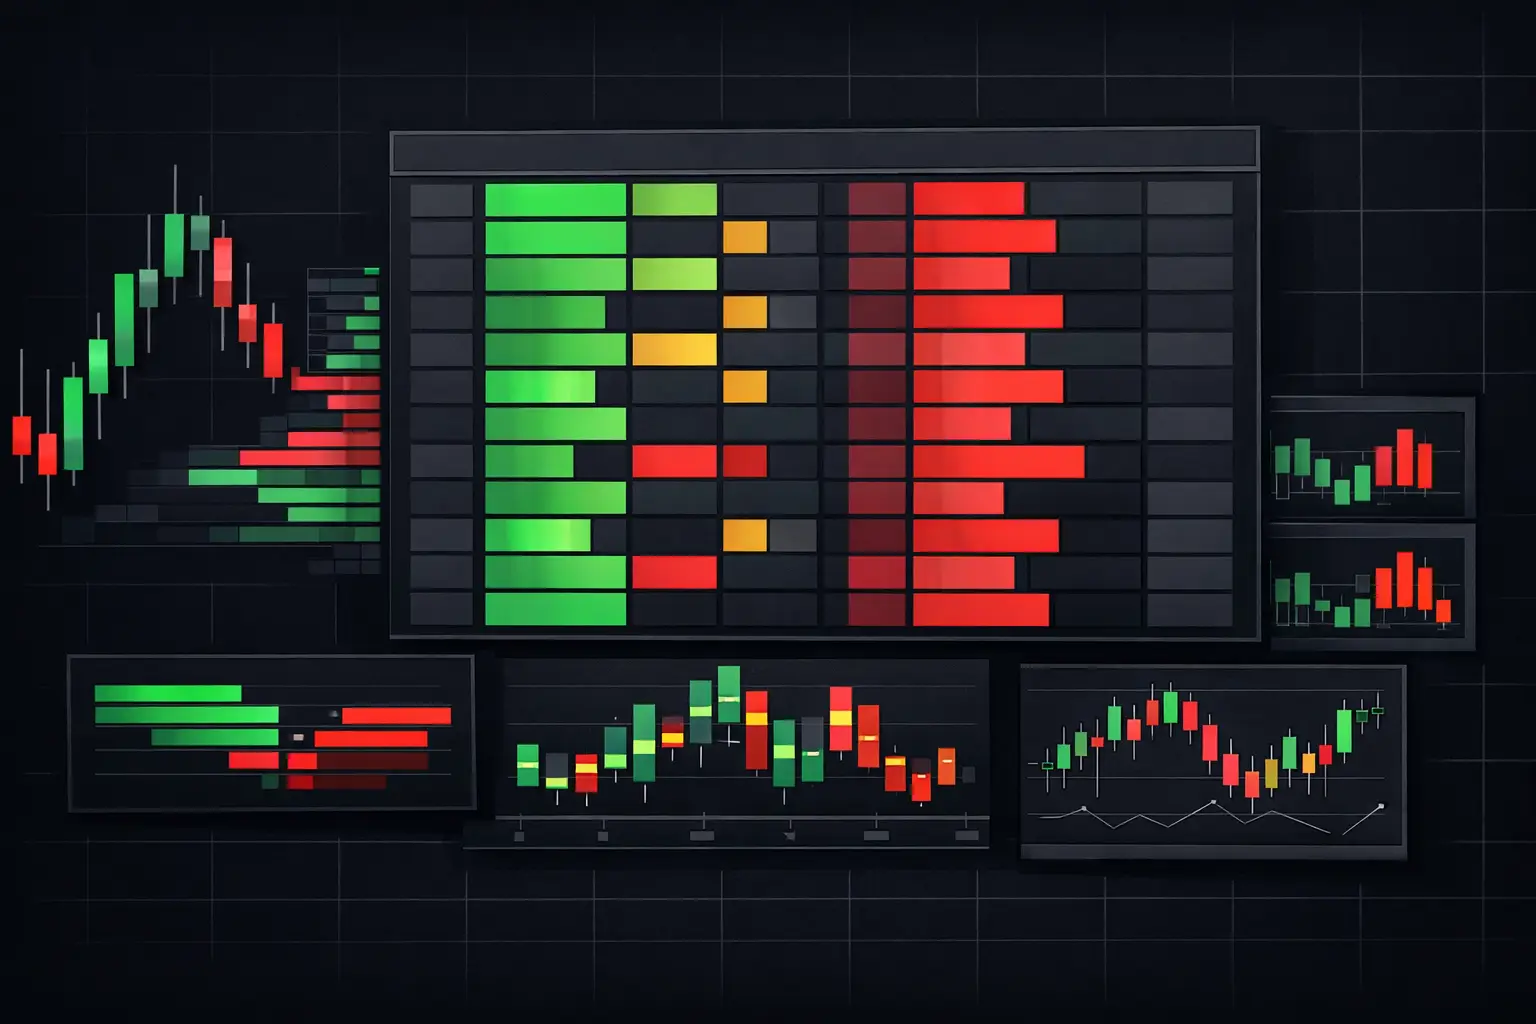
Use an order flow indicator free trial to test footprint speed, bid/ask detail, profiles, and real-time configuration in NinjaTrader 8 futures markets.
Best NinjaTrader Chart Customization Features
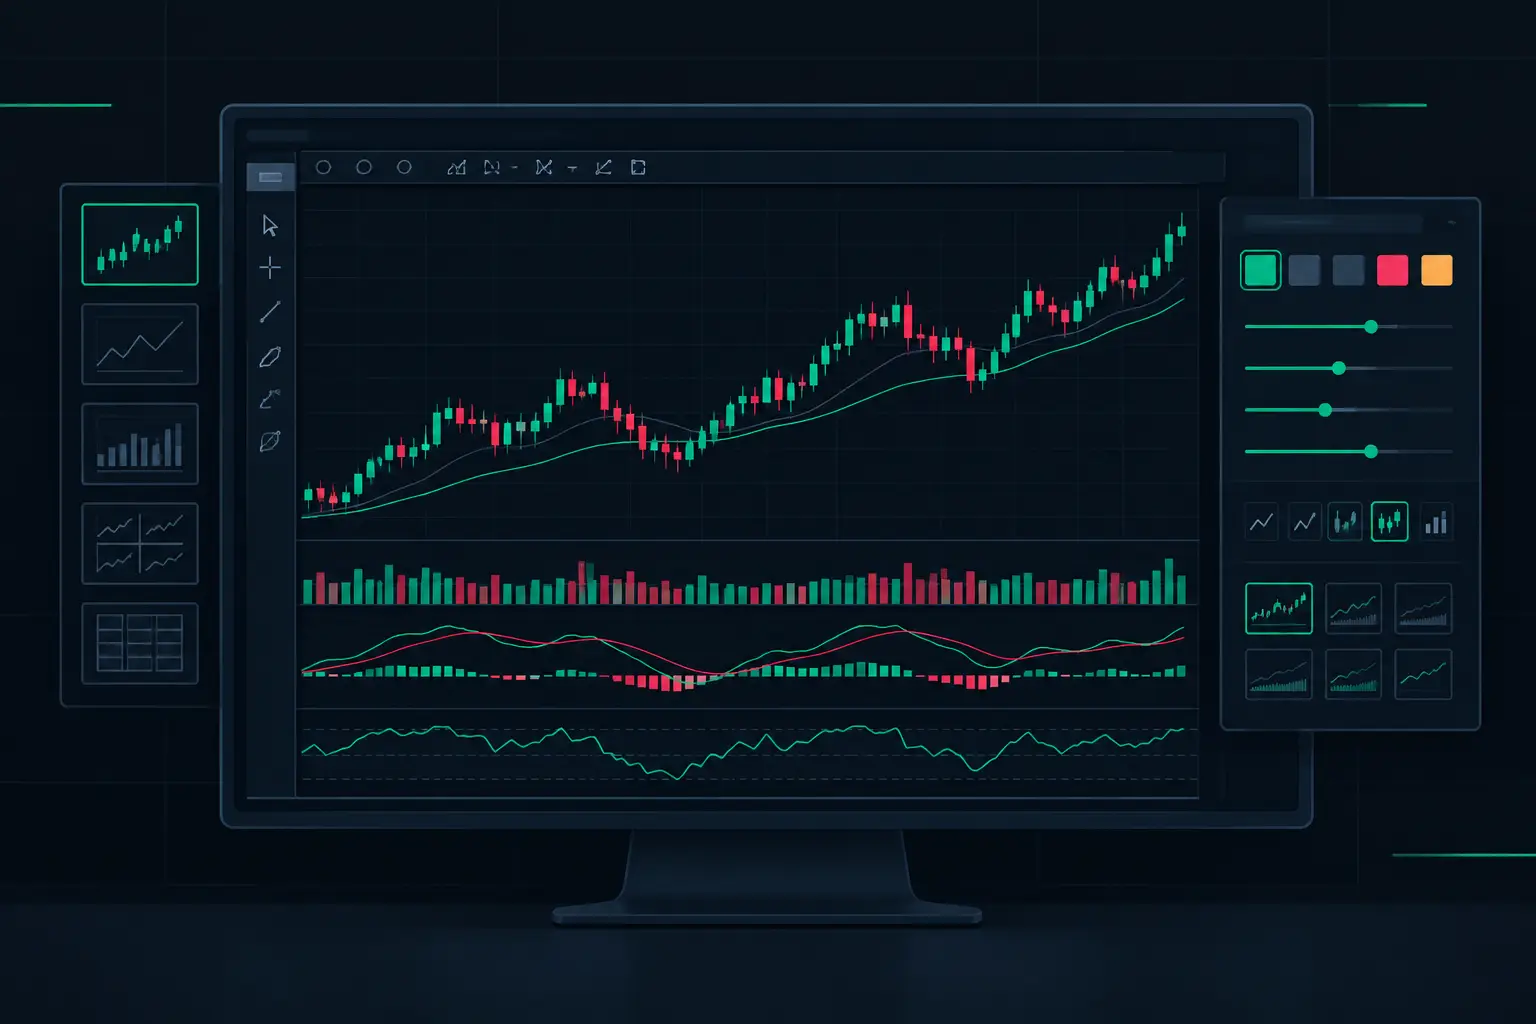
See the best NinjaTrader chart customization features for footprint, profiles, alerts, and fast order-flow context when ES auction speed increases at open.
High Volatility Order Flow Example Explained
A high volatility order flow example shows how delta, stacked imbalances, absorption, and VPOC expose the auction when price accelerates across the range.
See it on your own chart.
SidiBacktestTool is unlocked in the free 14-day demo, together with every other Sidi tool for NinjaTrader 8.
Start free 14-day demo → All tools and prices