
Best NinjaTrader Chart Customization Features
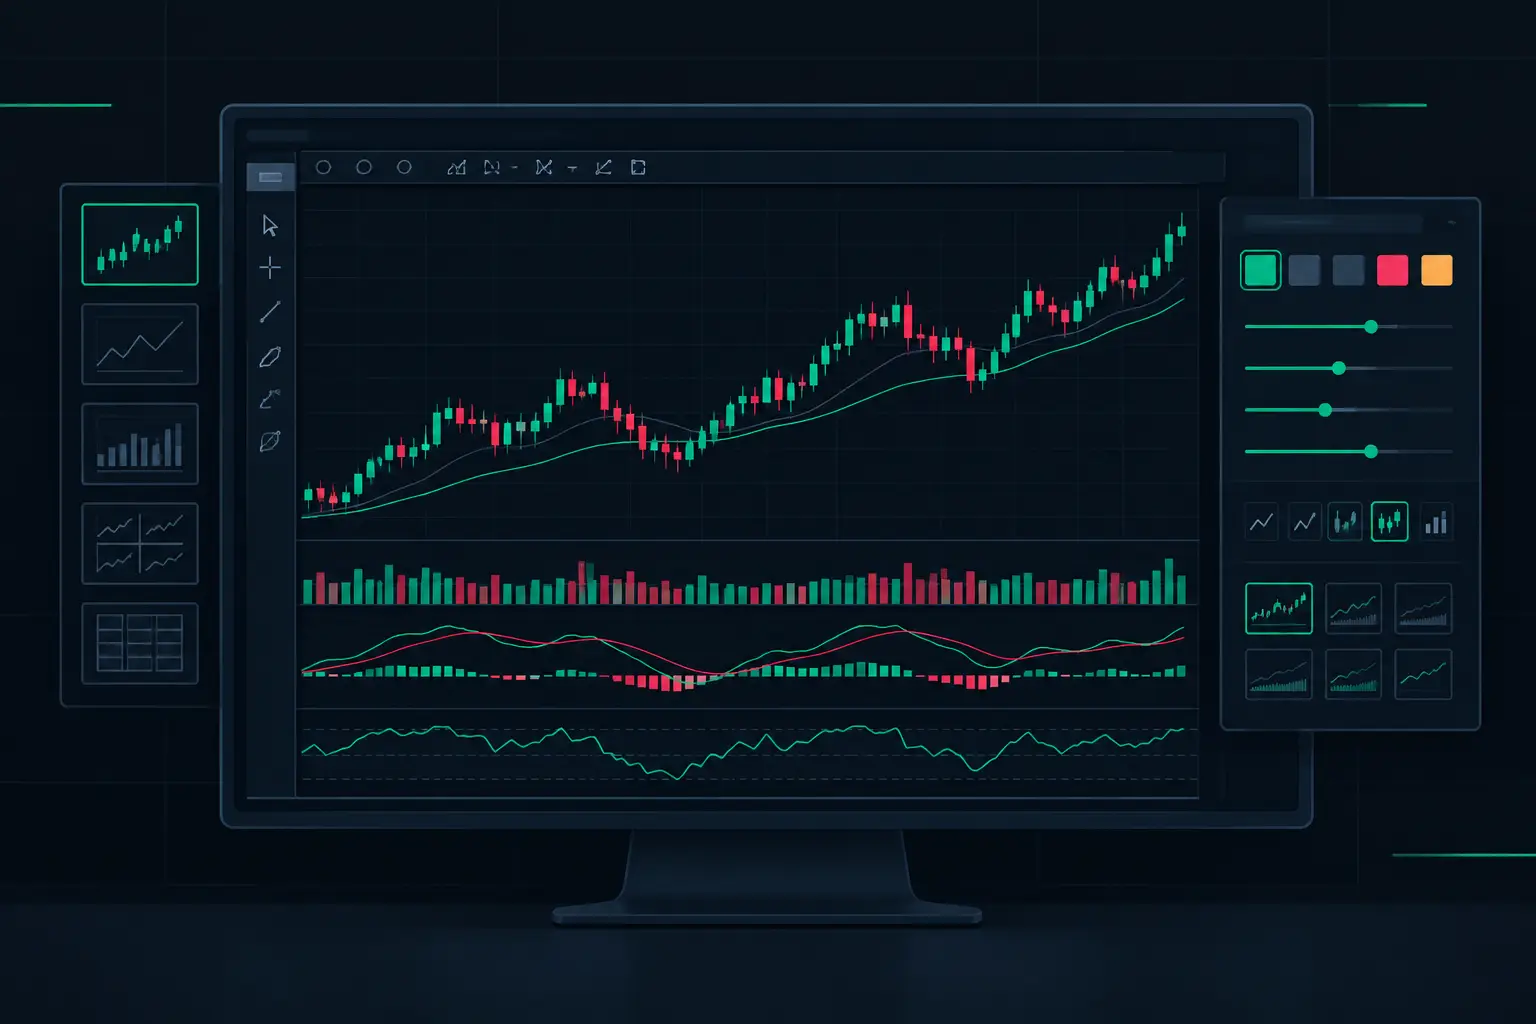
A fast ES rotation does not leave time to interpret a generic candle, then search across separate panels for volume context, delta, and profile structure. The best NinjaTrader chart customization features are the ones that put those calculations at the price level, preserve a readable hierarchy, and stay responsive while the auction accelerates. Customization is not a color exercise. It is the process of deciding which auction information earns space on the chart and which information becomes noise.
For order-flow traders, the chart must answer a narrower question than a conventional candle chart: what actually traded here, who was aggressive, where did participation concentrate, and did price accept or reject that activity? NinjaTrader 8 provides a flexible canvas. A properly configured footprint workspace turns that canvas into execution-grade market visibility.
Best NinjaTrader Chart Customization Features Start at the Price Level
The first priority is the footprint cell itself. A single bar can display bid volume, ask volume, total volume, delta, number of trades, or a combination of those values. There is no universally correct cell format. A trader focused on aggressive participation may place bid x ask volume at the center of the workflow. A trader studying initiative versus responsive activity may emphasize delta and total volume. The key is to choose a primary read, not attempt to give every calculation equal visual weight.
SidiFootprint supports multiple display modes and extensive formatting controls, so the cell can be built around the information that matters at speed. Numbers should remain legible at the chart's working bar width. If labels overlap or become too small during a volatile sequence, additional data has reduced rather than improved visibility. Use font size, row height, horizontal spacing, and minimum volume filters together instead of adjusting one setting in isolation.
Separate important volume from ordinary volume
Color thresholds are among the highest-value customization controls because the market prints a great deal of ordinary activity. A footprint chart should reserve strong contrast for exceptional participation. Configure separate color logic for high bid volume, high ask volume, positive delta, negative delta, and unusually large total volume. The threshold can be a fixed number, but relative logic often holds up better across changing intraday conditions.
For example, a fixed 500-contract threshold can be meaningful during one ES period and nearly irrelevant during another. Percentile-based or session-relative highlighting adapts to the distribution of activity. Fixed thresholds still have a place when monitoring a specific instrument at a stable scale. The trade-off is simple: fixed values create consistency, while relative values better expose what is unusual now.
Avoid using the same bright color for every condition. If high volume, positive delta, stacked imbalances, and VPOC all use aggressive green, the chart loses its hierarchy. Assign color by analytical purpose. Let directional aggression use one family, concentration use another, and structural reference levels use a third. A glance should distinguish an imbalance from a volume concentration before the numbers are read.
Configure diagonal imbalances with context
Diagonal imbalances compare ask volume at one price with bid volume one tick below, or bid volume at one price with ask volume one tick above. This comparison exposes aggressive lifting or hitting across adjacent prices more directly than a raw volume number. The ratio threshold, minimum volume requirement, and stacked imbalance count should all be configurable.
A low ratio threshold marks more events and can be useful when studying broad participation. It also produces more visual density. A higher threshold isolates stronger one-sided aggression but can hide developing behavior before it becomes extreme. The right configuration depends on the bar type, instrument pace, and whether the chart is being used for fine-grained auction reading or broader intraday structure.
Stacked imbalances deserve their own treatment. A sequence of aligned imbalances across multiple price levels is structurally different from a single highlighted print. Display stacked areas with a distinct background, border, or extension level so they remain visible after the bar closes. If every isolated imbalance extends across the chart, old references will overwhelm current price action. Extension rules should be selective.
Profile Columns Should Be Independent, Not Decorative
Volume profile is often placed beside a footprint chart as an afterthought. That wastes one of the most useful areas of the layout. An independent profile column can show where volume accumulated within a bar, session, composite period, or a custom range. When two profile columns operate independently, the chart can hold both immediate and higher-order context without forcing the trader to switch views.
One column might display the developing profile for the current session, including developing VPOC and value area. The second can display a prior session, a custom composite, or a fixed range. This arrangement makes it possible to see current acceptance forming against established structure at the same time.
Make VPOC and value area visible without burying price
VPOC is useful only if it remains easy to locate. Configure its line weight and color so it stands apart from ordinary profile rows, but do not make it so dominant that it masks the footprint. Value-area boundaries need a quieter treatment. They are structural references, not alarms.
Developing levels and completed levels should also look different. A developing VPOC can migrate as volume accumulates. A completed session VPOC does not. Using the same visual style for both erases a critical distinction. Solid versus dashed lines, different opacity, or separate colors can establish that hierarchy without adding another panel.
A chart that contains current-session profile, composite profile, and footprint data can become crowded quickly. Reduce profile width before shrinking footprint text. The footprint is the active auction record. Profiles provide context around it.
Use Developing Bars to Track Auction Change
Closed bars are historical facts. Developing bars show the auction while it is still forming. The ability to update footprint values, delta, VPOC, and imbalance conditions in real time is one of the most consequential NinjaTrader chart customizations for active futures workflows.
That does not mean every intrabar change deserves emphasis. Configure developing-bar colors and markers differently from completed-bar conditions. A forming imbalance that disappears before the bar completes should not look identical to one that remains present at close. The same principle applies to developing delta extremes and migrating VPOC levels.
Absorption and exhaustion markers can add another layer when configured with discipline. Absorption describes aggressive volume meeting passive liquidity with limited price progress. Exhaustion describes activity thinning as an auction reaches an extreme. These conditions need thresholds tied to volume, delta, price movement, and location. A marker placed without location context is just another mark on the chart. A marker appearing at a session extreme, value-area boundary, or prior VPOC carries far more analytical weight.
Alerts Should Protect Attention, Not Replace Reading
An alert is most useful when it calls attention to an event that would otherwise be missed during a fast tape. NinjaTrader chart alerts can be configured around price levels, indicator conditions, stacked imbalances, delta extremes, or profile events. Text-to-speech alerts are particularly useful when the footprint chart is being monitored alongside other instruments or timeframes.
Keep alert rules narrow. A broad rule that announces every imbalance or every high-volume print trains the operator to ignore it. Better configurations focus on confluence: a stacked imbalance at a defined structural level, a developing VPOC migration through a reference, or absorption meeting a high-volume node. The chart remains the source of interpretation. The alert simply protects attention.
Build a Layout That Survives Fast Markets
The most sophisticated configuration fails if it slows down when data density rises. Bar width, tick aggregation, calculation settings, lookback depth, and the number of active visual objects all affect chart responsiveness. A footprint chart should be tested during the heaviest periods of the session, not only during quiet conditions.
Start with the smallest set of visuals required for your read: footprint cells, one primary imbalance treatment, a developing profile, and essential reference levels. Then add secondary information only when it changes how the auction is interpreted. This is where a high-performance tool matters. SidiFootprint is engineered for real-time NinjaTrader 8 environments while offering more than 1,000 configuration options, but the goal is not to activate every option. The goal is to create a chart that stays clear when the tape is moving too quickly for second guesses.
Save separate templates for different working contexts. A narrow, high-detail chart may suit short-term ES auction analysis, while a wider chart with composite profiles may suit a session-structure view. Do not force one layout to serve every purpose. Consistency within each layout matters more than visual uniformity across all of them.
The best chart is the one where the next change in participation is obvious: a developing VPOC shifts, stacked aggression forms, volume concentrates, or price fails to progress despite heavy activity. Build every setting around that standard, and remove anything that does not earn its place.
See it on your own chart.
Every Sidi tool is unlocked in the free 14-day demo. Install SidiFootprint in NinjaTrader 8 and load one of the finished color styles to start.
Start free 14-day demo → SidiFootprint features Browse color stylesRelated articles
Futures Order Flow Visualization Guide for E-mini
Use this futures order flow visualization guide to configure footprint, delta, VPOC, profiles, and imbalance context for fast E-mini auctions each day.
NinjaTrader 8 Order Flow Configuration Setup
Configure NinjaTrader 8 order flow configuration for precise footprint charts, profiles, imbalances, delta, and fast real-time market context on tape.

NinjaTrader 8 Footprint Chart for Faster Reads
Build a NinjaTrader 8 footprint chart that exposes delta, imbalances, absorption, VPOC, and auction context when futures order flow accelerates fast.