
Order entry where you are already looking.
The decision happens in the chart. SidiChartTrader puts the order entry there too: a price ladder along the price scale, buttons in the corner, keyboard and mouse shortcuts, and a preview line that shows exactly what would be sent before anything is.
What it puts on your chart
Order entry usually lives in its own window. You read the chart, you decide, you look away, you find the right price in a column of numbers, you click. The distance between the decision and the order is small in seconds and large in everything else, because the chart keeps moving while your eyes are elsewhere.
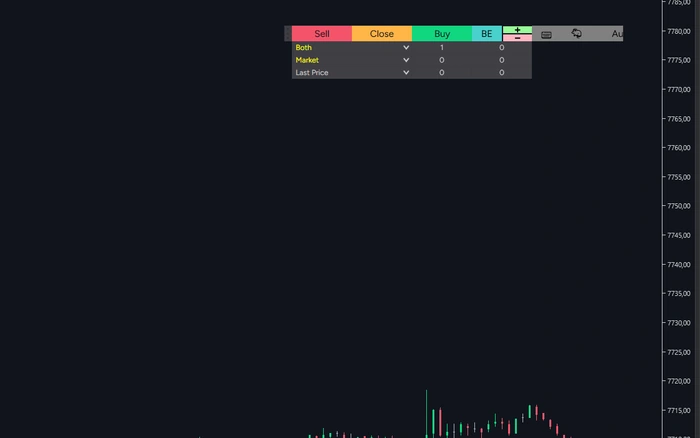
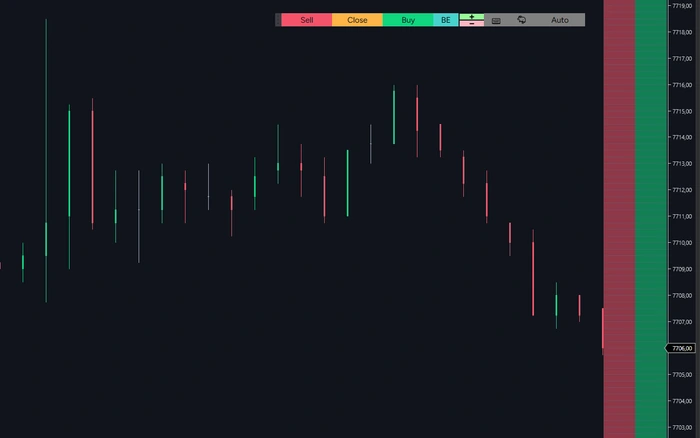
SidiChartTrader closes that distance. The price ladder runs along the price scale of the chart itself, so the row you click is at the height you were already looking at. The button block sits in the corner. The keyboard covers the rest. Before anything is sent, hovering a ladder row draws a preview line showing the order type, the quantity and the price, so the order is visible in the chart before it exists in the market.
Around that sit the parts that keep the panel honest: entry defaults so an order does not have to be assembled from scratch, four filters that can refuse to send one, a break-even line that shows your entry while a position is open, and a statistics overlay with the numbers of the running session. The 298 settings of version 3.4.0.0 are largely about placement, colour and labelling, because a control panel you have to search through is worse than no control panel at all.
Buttons in the corner, ladder at the scale, keys on the keyboard
Three ways to send the same order, because the right one depends on the moment. The button block in the top right corner covers sell, close, buy, break-even and auto, with the column layout, labels, colours and opacity of every button configurable one by one. The price ladder at the right edge is two tables, one for buys and one for sells, and a single click on a row places an order at that price. Keyboard and mouse trading covers the rest, including switching between ATM strategies without reaching for the mouse.
The session, in a corner of the chart
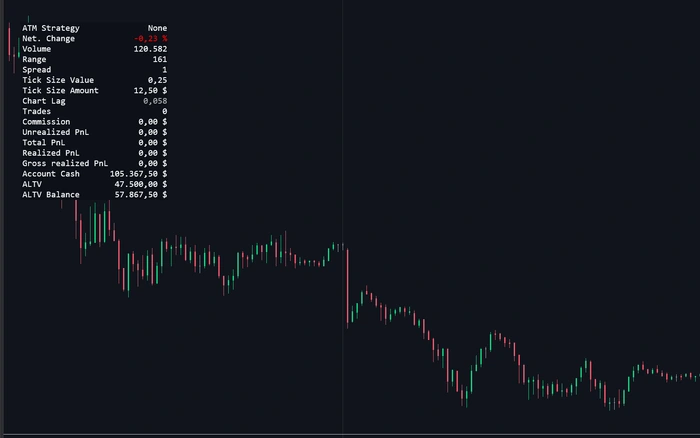
An overlay window in the chart carries the numbers of the running day, row by row, with your own choice of which rows appear, where the window sits, in which font, and which colours mark a positive, negative or neutral value. Below the chart, an optional panel adds the same reading over the calculated period. Nothing here has to be read from a second window.
What you can change.
298 settings in version 3.4.0.0, read out of the installed indicator. The list below is what they are for.
Order entry
- Button block in the chart corner: sell, close, buy, break-even and auto
- Per button its own label, colours and opacity, plus the column layout
- Price ladder at the right edge, one table for buys and one for sells
- Single click on a ladder row places an order at that price
- Grid lines of the ladder styled separately
- Keyboard trading with your own key assignment and required modifiers
- Mouse trading with modifier keys
Order preview
- Hovering the ladder draws a preview line in the chart
- Shows order type, quantity and price before anything is sent
- Own line styling, label font and gradient background
Defaults and filters
- Entry defaults: order type, limit offset, duration of pending orders, reference level and quantity
- Four filters that can block an order: allowed direction, maximum position size, maximum spread, maximum data delay
- Position sizing mode, switched off, as a percentage or as a fixed amount
- Daily limits for number of trades, winning trades and losing trades
- Automatic break-even after a set number of ticks in your favour
- Seven SidiFootprint detections can be enabled individually for automated entry
Readouts in the chart
- Break-even line at your entry level while a position is open, with its own label
- Statistics overlay with your choice of rows, position, font and colours
- Separate colours for positive, negative and neutral values
- Optional panel below the chart over the calculated period
- Sound and spoken alerts for tool events, above all the ATM strategy switch
- Spoken alerts with language, voice, rate and volume set once for the whole tool
Everything happens without leaving the chart
The tool is built around one idea: the chart is where you are looking, so the chart is where the controls belong. Fifteen blocks, from the order preview to the break-even line to the session overlay, exist to keep it that way.
Entering an order
- Button block with sell, close, buy, break-even and auto
- Click-to-place price ladder along the price scale
- Keyboard trading with your own key assignment
- Mouse trading with modifier keys
- Order preview line on hover, with type, quantity and price
- Entry defaults for order type, limit offset, duration and quantity
Around the order
- Entry filters for direction, size, spread and data delay
- Position sizing mode, off, percentage or fixed
- Daily limits for number of trades, winners and losers
- Automatic break-even after a set number of ticks
- Break-even line with its own label and styling
- Session statistics overlay and an optional panel below the chart
Change it while the market runs
SidiChartTrader has its own Realtime Settings window, opened from a button in the chart toolbar. Button colours and labels, ladder layout, the statistics rows and the appearance of the preview line change in the chart as you set them, and the window saves, loads and resets complete presets from its bottom bar. A layout that works on your scalping chart can be saved and loaded on the next instrument.
A few fields change what is calculated rather than how it is drawn, and those still ask for a chart reload (F5). Everything visual answers immediately.
Pick your licence.
Every plan includes free updates. Secure checkout handled by Freemius.
One licence, any of your computers
The licence is tied to your email address, not to a machine ID. You can install SidiChartTrader on as many computers as you like and run it on one of them at a time.
Before you install.
Q · 01What is the difference between SidiChartTrader and SidiChartTrader FP?+
Q · 02How does the price ladder work?+
Q · 03Can I trade from the keyboard?+
Q · 04What can stop an order from going out?+
Q · 05Does it work with NinjaTrader ATM strategies?+
Q · 06Which NinjaTrader version does it need?+
Q · 07What do I get in the free demo?+
Read more
Order Flow Scalping for Fast Futures Markets
Order flow scalping reads executed volume, delta, liquidity, and response at each price so futures traders can frame fast intraday auctions with precision.
NinjaTrader Order Flow Alerts for Fast Markets
NinjaTrader order flow alerts turn footprint events, delta shifts, and absorption into immediate chart and audio awareness during fast futures sessions.
Footprint Chart Software for Faster Order Flow
Footprint chart software for NinjaTrader 8 shows bid/ask activity, delta, imbalances, profiles, and absorption at every traded price level in real time.
See it on your own chart.
SidiChartTrader is unlocked in the free 14-day demo, together with every other Sidi tool for NinjaTrader 8.
Start free 14-day demo → All tools and prices