
Every release, already on the chart.
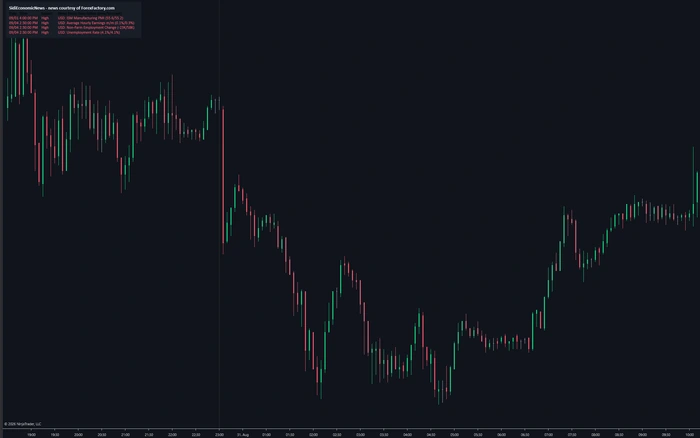
Economic releases move markets on a schedule that is known in advance. SidiEconomicCalendar puts that schedule into the chart itself: vertical lines at the release time, coloured by impact, filtered by the countries you trade.
What it puts on your chart
The release calendar is the one piece of market information that is known in advance and still regularly catches people out. Not because it is hard to find, but because it lives in a browser tab, in a different time zone, next to fifty releases from countries that have nothing to do with the contract on the screen.
SidiEconomicCalendar moves it into the chart. Each release you care about becomes a vertical line at its scheduled time, in the colour of its impact level, labelled in your date and time format. The end of the session gets its own line. What appears is decided by filters you set once: which countries, which impact levels, and whether you want the whole week, only what is still ahead, or only what has already happened.
Alongside the chart lines, the calendar window shows the week as a grid with forecast and previous values, and the export tab writes the event data out as JSON for any date range. The 107 settings of version 3.8.0.0 are mostly filters and appearance, because a calendar on a chart is only useful for as long as it stays selective.
A line where the release happens
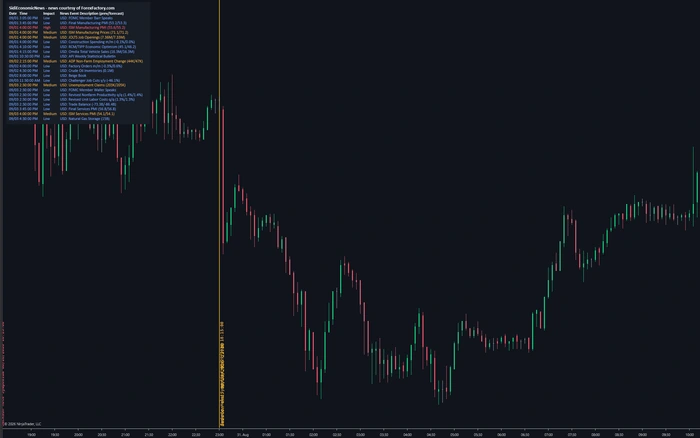
Every release becomes a vertical line at its scheduled time, in the colour of its impact level. One switch decides what is shown at all: every event of the current week, only the ones still ahead, only the ones already past, or none. A second line marks the end of the trading session, built the same way, with its own colour, style and label.
The whole week, filterable
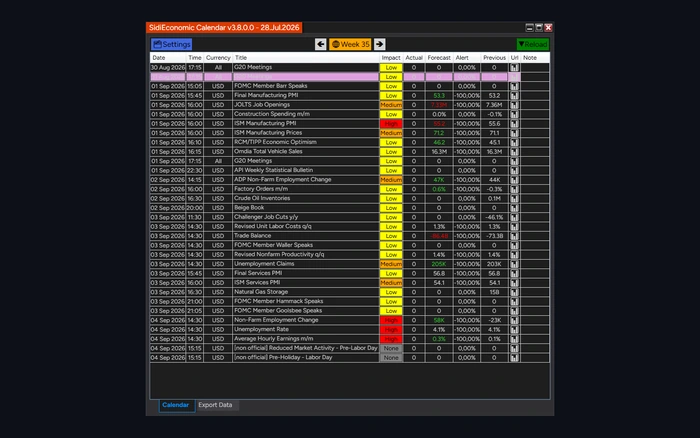
Next to the chart lines sits the calendar window itself. It lists the week by day and time with country, impact, the forecast and the previous reading, and it filters down to what you actually trade. Nine country settings and seven impact settings decide both what the window shows and what reaches the chart.
The data, in a file
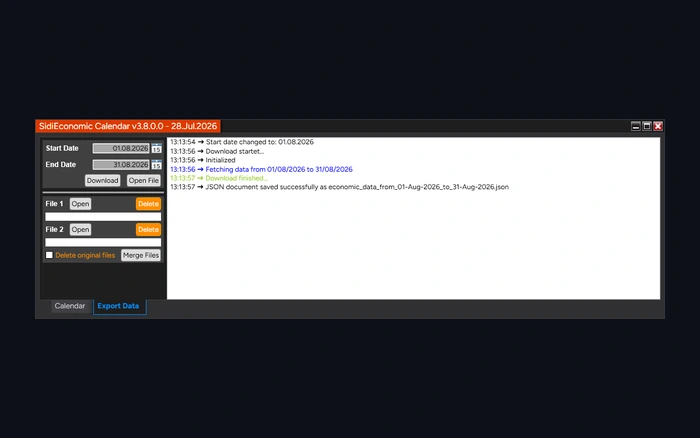
The event data does not stay locked inside the indicator. Pick a date range and export it as JSON, which is what you want when you are checking how an instrument behaved around a particular release, or when the calendar has to feed something outside NinjaTrader.
What you can change.
107 settings in version 3.8.0.0, read out of the installed indicator. The list below is what they are for.
Events in the chart
- Vertical line at each release time
- Colour per impact level, set separately
- Visibility mode: all events of the week, upcoming only, past only, or none
- Label with its own font, size, colour and date and time format
- Country filter with nine settings, impact filter with seven
Session line
- Marks the end of the trading session in the chart
- Own visibility switch, colour and opacity
- Own line style and label, independent of the event lines
- Own date and time format
Calendar window
- The week as a grid, by day and release time
- Country, impact, forecast and previous value per entry
- Filters down to the countries and impact levels you selected
- Export of the event data as JSON over a chosen date range
In the chart
- Realtime Settings window, opened from a button in the chart toolbar
- Indicator name row can be hidden to keep the chart clean
- Bar index at the mouse position for precise navigation
- Drawing order against other indicators, set by Z value
- Logging to the NinjaScript output window, the Control Center log tab, or a file of its own
You decide what reaches the chart
A calendar that shows every release from every country is noise on a futures chart. The filters are the point of the tool, and they apply to the chart lines and to the calendar window alike.
Filters
- Countries you care about
- Impact level, with its own colour each
- Visibility: whole week, upcoming only, past only, or off
- Session end line, on or off
Appearance
- Colour per impact level
- Line style and opacity
- Label with own font, size and colour
- Own date and time format
- Session line styled independently
- Drawing order against other indicators
Change it while the market runs
SidiEconomicCalendar has its own Realtime Settings window, opened from a button in the chart toolbar, and it carries more toolbar settings than the other tools because the calendar is opened from there. Filters, colours, line styles and the visibility mode change in the chart as you set them, and the window saves, loads and resets complete presets from its bottom bar.
A few fields change what is calculated rather than how it is drawn, and those still ask for a chart reload (F5). Everything visual answers immediately.
Pick your licence.
Every plan includes free updates. Secure checkout handled by Freemius.
One licence, any of your computers
The licence is tied to your email address, not to a machine ID. You can install SidiEconomicCalendar on as many computers as you like and run it on one of them at a time.
Before you install.
Q · 01Which events does it show?+
Q · 02Can I see past releases as well as upcoming ones?+
Q · 03What is the session line?+
Q · 04Can I get the data out of NinjaTrader?+
Q · 05Which NinjaTrader version does it need?+
Q · 06What do I get in the free demo?+
Read more
High Volatility Order Flow Example Explained
A high volatility order flow example shows how delta, stacked imbalances, absorption, and VPOC expose the auction when price accelerates across the range.
NinjaTrader Order Flow Alerts for Fast Markets
NinjaTrader order flow alerts turn footprint events, delta shifts, and absorption into immediate chart and audio awareness during fast futures sessions.
Order Flow Scalping for Fast Futures Markets
Order flow scalping reads executed volume, delta, liquidity, and response at each price so futures traders can frame fast intraday auctions with precision.
See it on your own chart.
SidiEconomicCalendar is unlocked in the free 14-day demo, together with every other Sidi tool for NinjaTrader 8.
Start free 14-day demo → All tools and prices