
The levels everyone watches, drawn for you.
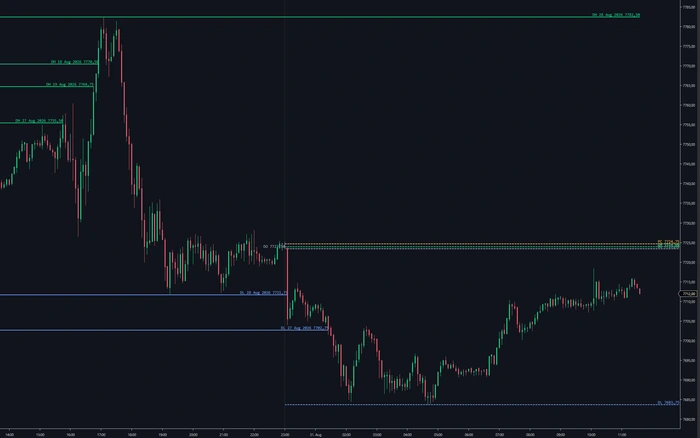
Session open, day high, day low, the prior close, the highs and lows of the days before, the opening range and the round numbers. SidiIntervalLevels draws them from the chart data itself, labels each one and keeps them there while the session runs.
What it puts on your chart
Every session has a handful of prices that the whole room is looking at. Where it opened, how far it has travelled since, where yesterday closed, where the first few minutes drew their boundary. None of those are opinions; they follow from the data. What they need is someone to draw them, correctly, every single day.
SidiIntervalLevels does that. It reads the chart's own session definition, works out the levels, draws them as labelled lines and keeps them updated while the session runs. The opening range is built the way you define it rather than the way one convention defines it, and the round-number grid adapts to the step size your contract actually trades in.
The 213 settings of version 3.5.0.0 are almost entirely about appearance: which group is visible, in which colour, with which line style, with which label, and how far to the right it runs. That is the part that decides whether seven groups of lines on one chart read as information or as clutter.
The four levels of the running day, plus every day before
The intraday block draws four levels: the session open, the high and the low so far, and the close of the previous day. Each one can be switched on and coloured on its own. The historical block does the same thing backwards, drawing the high and low of every prior day as far back as you set it. Line style, width, opacity and the text label are configured once and apply to the whole group.
An opening range you define, not one that is handed to you
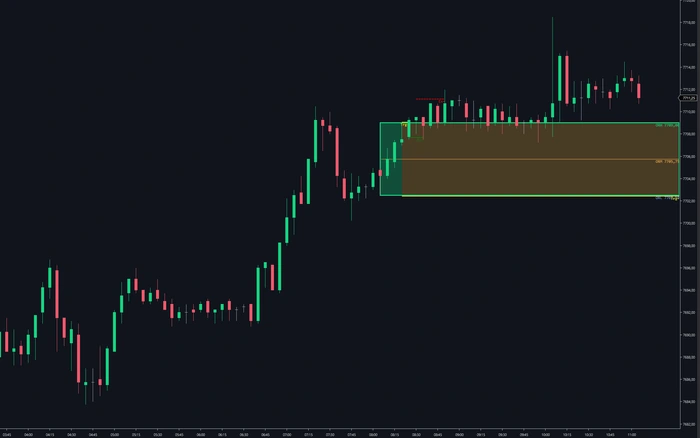
The opening range is the span of the first minutes after the open, and every desk measures it differently. Here you pick the method: a number of bars, a number of ticks, or a fixed time window entered in UTC so it does not drift when clocks change. On top of the range itself come three more line sets, entry, exit and trigger, each with its own offset, colour and label.
Round numbers, at whatever step your instrument trades in
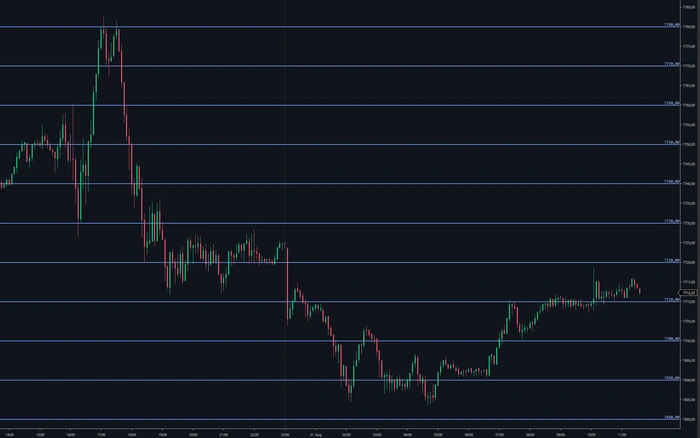
Round numbers attract resting orders, and the step that matters depends on the contract. Set the step size once and the lines rebuild themselves as the chart scrolls, with their own line style and an optional price label. Nothing has to be redrawn by hand when the market moves into a new range.
What you can change.
213 settings in version 3.5.0.0, read out of the installed indicator. The list below is what they are for.
Intraday levels
- Session open, session high, session low and prior day close
- Each level switched on and coloured separately
- Shared line style, width, opacity and extension for the group
- Price label with its own font, size, position and format
Historical levels
- Day highs and day lows of the preceding days as horizontal lines
- Days to load sets how far back the calculation reaches
- Own line and label settings, independent of the intraday group
Opening range
- Calculation from a bar count, a tick count or a time window
- Time window entered in UTC, so it does not shift with daylight saving
- Range high, mid and low drawn and labelled
- Entry, exit and trigger lines derived from the range, nine settings each
- Own visibility, colours and extension for every line set
Round numbers
- Step size in price units, so 100 on NQ and 50 on ES are one field
- Lines rebuild as the chart scrolls into a new range
- Own line style and optional price label
Alerts and chart
- One alert each for session open, intraday high and low, historical high and low
- Per alert a switch, a lock-out time, a .wav file and a spoken text
- Spoken alerts with language, voice, rate and volume set once for the whole tool
- Realtime Settings window, opened from a button in the chart toolbar
- Indicator name row, bar index at the mouse position, drawing order and right margin
Seven kinds of level, one indicator
Each group has its own visibility switch, its own colours and its own labels, so a prior day low never looks like a round number. Five of them can also raise an alert when price reaches them.
Reference levels
- Session open
- Session high
- Session low
- Prior day close
- Prior day highs
- Prior day lows
- Round numbers
Opening range
- Range high, mid and low
- Entry lines
- Exit lines
- Trigger lines
- Built from bars, ticks or a UTC time window
- Own colours, labels and extension per set
Change it while the market runs
SidiIntervalLevels has its own Realtime Settings window, opened from a button in the chart toolbar. Colours, line styles, visibility and labels change in the chart as you set them, and the window saves, loads and resets complete presets from its bottom bar. Position and colour scheme of the window itself are yours to set.
A few fields change what is calculated rather than how it is drawn, and those still ask for a chart reload (F5). Everything visual answers immediately.
Pick your licence.
Every plan includes free updates. Secure checkout handled by Freemius.
One licence, any of your computers
The licence is tied to your email address, not to a machine ID. You can install SidiIntervalLevels on as many computers as you like and run it on one of them at a time.
Before you install.
Q · 01How is the opening range calculated?+
Q · 02What are the entry, exit and trigger lines?+
Q · 03How far back do the prior day levels go?+
Q · 04Can I get an alert when price reaches a level?+
Q · 05Which NinjaTrader version does it need?+
Q · 06What do I get in the free demo?+
Read more
Best NinjaTrader Chart Customization Features
See the best NinjaTrader chart customization features for footprint, profiles, alerts, and fast order-flow context when ES auction speed increases at open.
Session Volume Profile NinjaTrader Setup
Configure a session volume profile in NinjaTrader 8 to track VPOC, value area, developing distribution, and order flow at every price level with precision.

NinjaTrader 8 Footprint Chart for Faster Reads
Build a NinjaTrader 8 footprint chart that exposes delta, imbalances, absorption, VPOC, and auction context when futures order flow accelerates fast.
See it on your own chart.
SidiIntervalLevels is unlocked in the free 14-day demo, together with every other Sidi tool for NinjaTrader 8.
Start free 14-day demo → All tools and prices