
The order book, inside the chart.
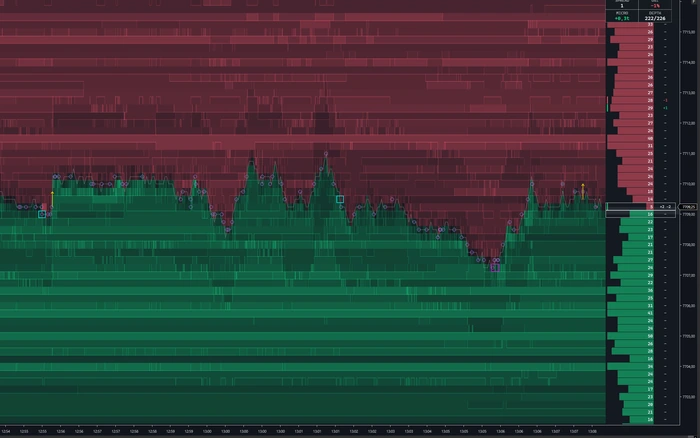
A separate DOM window makes you look away from the chart and match prices in your head. SidiLevel 2 draws the depth of market into the price chart itself, aligned to the price scale, and keeps the last twenty minutes of it as a heatmap behind the price line.
What it puts on your chart
A depth of market window tells you what is resting in the book right now. What it cannot tell you is what was resting there a minute ago, because the moment a level changes, the old state is gone. That missing history is most of the story: size that sat at a price for ten minutes and then vanished as price approached says something different from size that appeared two seconds ago.
SidiLevel 2 keeps it. The live book is drawn into the price chart, aligned to the price scale, and roughly twenty minutes of its history stay behind the price line as a heatmap. A wall you can see forming, holding and then disappearing is a different object than a number in a column.
Around that sit the analysis blocks: spread and book imbalance in an overlay, hints on the levels holding the most size, detection of changes in the book, and a heuristic layer that flags iceberg and spoof candidates. None of those claim certainty. The book shows what happened to the quotes, not why, and the 141 settings of version 3.4.0.0 exist so you can tune what gets flagged and how loudly, on your instrument, in your colours.
Depth at the price it belongs to
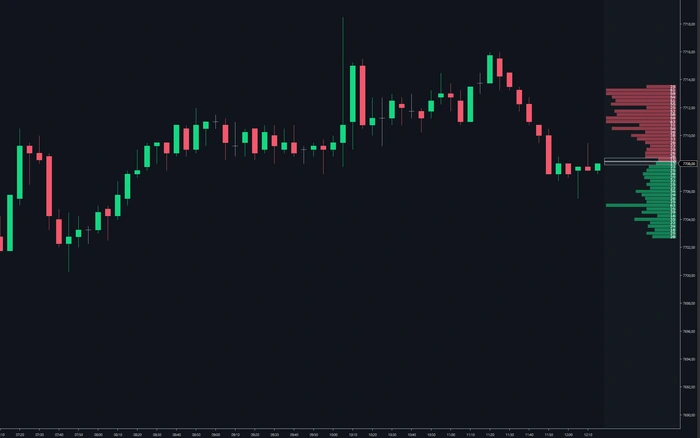
The depth of market shows how much size is currently resting at each price. Drawn into the chart and aligned to the price scale, it stops being a table you read and becomes part of the picture: a wall of size sits at the same height as the bars that will run into it. Bar scaling, layout, how much chart width it takes, the text on each level and the appearance of the whole block are yours to set.
The numbers behind the picture
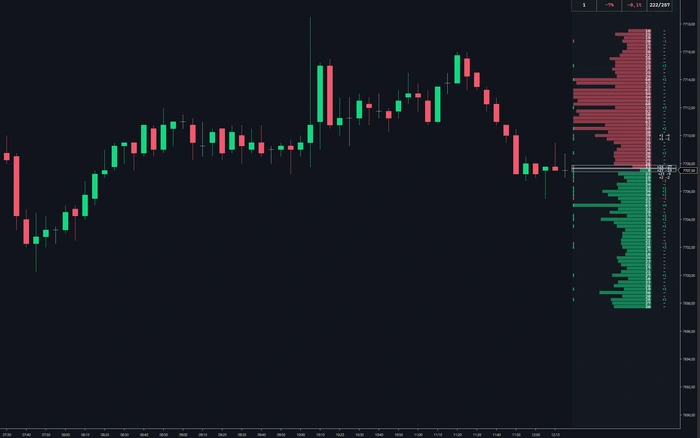
On top of the raw book comes a layer of analysis. The overlay carries the current spread, the imbalance between bid and ask depth, a depth counter and hints on the levels that currently hold the most size. Separately, an event detection block watches for changes in the book, and a heuristic block flags iceberg and spoof candidates, which can raise their own spoken alert.
Nine finished colour worlds, or your own
A heatmap only works if the eye can separate a lot of size from a little at a glance, and that depends on your monitor, your chart background and your eyes. Nine finished colour worlds ship with the tool, from arctic blue through amber, teal, violet, forest, ice, gold and muted steel to high-contrast neon, and every colour and opacity in them remains editable.

What you can change.
141 settings in version 3.4.0.0, read out of the installed indicator. The list below is what they are for.
Depth of market
- Order book drawn into the price chart, aligned to the chart price scale
- Bar scaling so a large resting size stays readable next to a small one
- Layout control over how much chart width the block takes
- Text on each level with its own font, size and format
- Executed trades shown as bubbles, with their own sizing
Liquidity heatmap
- Roughly twenty minutes of order book history kept behind the price line
- Nine finished colour worlds, from arctic and ice to neon and gold
- Every colour and opacity in the map remains editable
- Own switch, so the heatmap can run without the live depth block
Analysis
- Spread, order book imbalance and depth counter in an overlay
- Hints on the levels currently holding the most size
- Event detection for changes in the book
- Heuristic candidates for iceberg and spoof patterns, flagged as candidates, not as findings
- Snapshot export of the current book state
Alerts and chart
- Alert when a new candidate is flagged, separately for each of the two types
- Own .wav file and own spoken text per type, with a shared lock-out time
- Spoken alerts with language, voice, rate and volume set once for the whole tool
- Realtime Settings window, opened from a button in the chart toolbar
- Indicator name row, bar index at the mouse position, drawing order and right margin
Twelve blocks in one indicator
The Level 2 section alone carries seventy-one settings across twelve blocks. Each one can be switched off, so the tool can be a plain depth display, a pure heatmap, or everything at once.
Drawing the book
- DOM basics
- Layout and chart space
- Bars and scaling
- Pro-DOM appearance
- Level text
- Trades and bubbles
Reading the book
- Liquidity analysis
- Liquidity heatmap
- Event detection
- Heuristic candidates
- HUD and level hints
- Snapshot export
Change it while the market runs
SidiLevel 2 has its own Realtime Settings window, opened from a button in the chart toolbar. Colours, scaling, layout width, the heatmap palette and which analysis blocks are visible change in the chart as you set them, and the window saves, loads and resets complete presets from its bottom bar. Switching the heatmap to a different colour world while the book is moving takes one click.
A few fields change what is calculated rather than how it is drawn, and those still ask for a chart reload (F5). Everything visual answers immediately.
Pick your licence.
Every plan includes free updates. Secure checkout handled by Freemius.
One licence, any of your computers
The licence is tied to your email address, not to a machine ID. You can install SidiLevel 2 on as many computers as you like and run it on one of them at a time.
Before you install.
Q · 01Do I need Level 2 data for this?+
Q · 02How far back does the heatmap go?+
Q · 03What are iceberg and spoof candidates?+
Q · 04Does it replace the NinjaTrader SuperDOM?+
Q · 05Which NinjaTrader version does it need?+
Q · 06What do I get in the free demo?+
Read more
Bid Ask Volume Indicator NinjaTrader Explained
Use a bid ask volume indicator NinjaTrader chart to expose volume, delta, imbalances, absorption, and profile context at every price level across futures.
Big Lot Order Flow Indicator for Futures Charts
A big lot order flow indicator separates concentrated aggressive volume from passive absorption, so futures charts show size, location, and response live.
Absorption Trading Footprint Charts Explained
Absorption trading footprint charts expose passive liquidity absorbing aggressive orders, helping futures traders read stalled auctions as it unfolds.
See it on your own chart.
SidiLevel 2 is unlocked in the free 14-day demo, together with every other Sidi tool for NinjaTrader 8.
Start free 14-day demo → All tools and prices