
Which levels still hold, and which are gone.
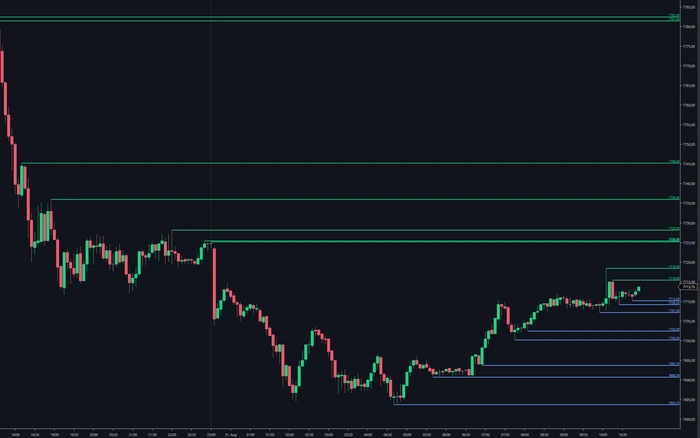
SidiSwing finds the swing highs and lows in your chart, draws a line from each one and keeps drawing it until price takes it out. Broken and unbroken levels look different, so the chart answers the question before you ask it.
What it puts on your chart
Structure is the part of a chart that people draw by hand and then forget to update. A high that mattered yesterday still has a line on it today, long after price walked through it. A low from an hour ago never got a line at all because the move was fast.
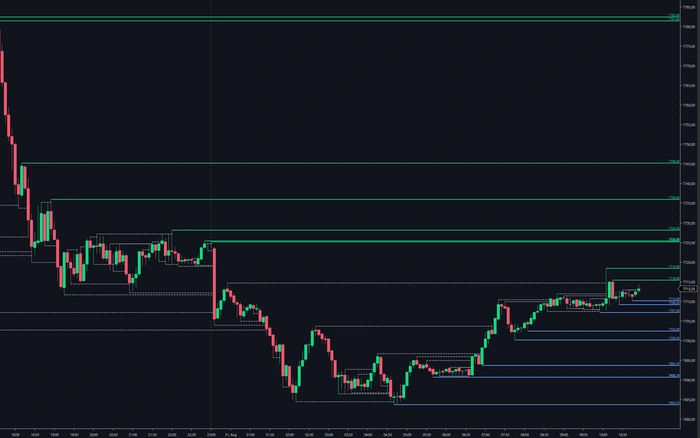
SidiSwing takes that job off the chart. It applies one rule, consistently, to every bar: a swing high is a bar that no bar within a set distance exceeds, on either side. Every point it finds gets a line and a price label, and the moment price cuts through one, the line changes its appearance instead of quietly staying the same.
That last part is the whole idea. A chart full of horizontal lines tells you nothing if they all look alike. With broken and unbroken drawn differently, and with the option to hide the broken ones entirely, the chart shows what is still standing. The 88 settings of version 3.3.0.0 exist so that distinction stays readable in your colours, at your line weights, on your instrument.
A broken level stops where it was broken
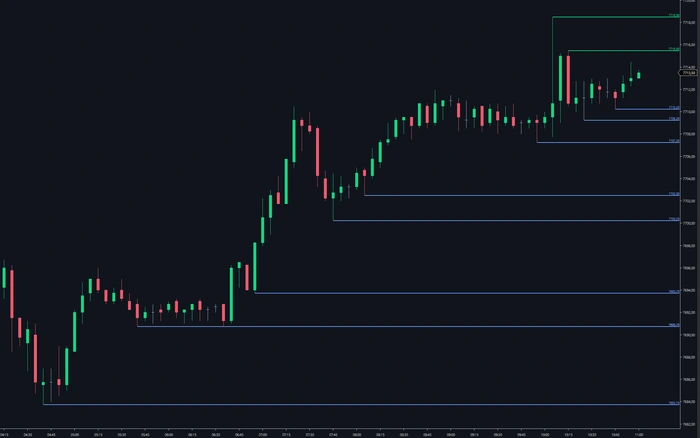
Four states are drawn separately: swing high unbroken, swing high broken, swing low unbroken, swing low broken. Each has its own colour, line style, width and opacity. An unbroken level runs to the right edge because it is still in play. A broken one stops at the bar that cut through it, so the chart keeps the record without cluttering the area where price is trading now.
Every level carries its price
Each swing point can carry a text label with the price it marks, in the font, size, colour and position you pick. In a chart that has been scrolled back or zoomed out, that label is often the difference between reading the structure and counting pixels against the price scale.
One number decides how much structure you see
Swing strength is the number of bars that must stay below a high, or above a low, on both sides for it to count. Set it low and you get the fine structure of the last hour. Set it high and only the turns that held for a long time survive. It is one field, and it changes the entire reading of the chart.
What you can change.
88 settings in version 3.3.0.0, read out of the installed indicator. The list below is what they are for.
Detection
- Swing strength in bars, applied to both sides of the candidate bar
- Swing highs and swing lows found on the chart's own bar series
- Levels update as new bars close, without a manual redraw
- Max Days To Load caps how far back the calculation reaches
Appearance
- Separate colour, dash style, width and opacity for each of the four states
- Visibility switch per state, so you can show only what is still unbroken
- Extension to the right edge for levels still in play
- Broken levels end at the bar that took them out
Labels
- Price label at each swing point
- Own font family, weight, style and size
- Own colour and opacity, or the colour of the line it belongs to
- Position and offset relative to the level
In the chart
- Realtime Settings window, opened from a button in the chart toolbar
- Indicator name row can be hidden to keep the chart clean
- Bar index at the mouse position for precise navigation
- Drawing order against other indicators, set by Z value
- Logging to the NinjaScript output window, the Control Center log tab, or a file of its own
Four states, drawn four ways
A swing high is a bar whose high is not exceeded by a set number of bars to its left and to its right. A swing low is the same, upside down. Out of that come four states, and each one gets its own appearance so you never have to work out which is which.
What gets drawn
- Swing high, unbroken
- Swing high, broken
- Swing low, unbroken
- Swing low, broken
How it is drawn
- Swing strength in bars
- Which states are visible at all
- How far each line runs to the right
- Colour, dash style, width and opacity per state
- Price label with font, size, colour and position
- Drawing order against other indicators
Change it while the market runs
SidiSwing has its own Realtime Settings window, opened from a button in the chart toolbar. Colours, line styles, visibility and labels change in the chart as you set them, and the window saves, loads and resets complete presets from its bottom bar. Trying two values of swing strength against each other takes seconds instead of two chart reloads.
A few fields change what is calculated rather than how it is drawn, and those still ask for a chart reload (F5). Everything visual answers immediately.
Pick your licence.
Every plan includes free updates. Secure checkout handled by Freemius.
One licence, any of your computers
The licence is tied to your email address, not to a machine ID. You can install SidiSwing on as many computers as you like and run it on one of them at a time.
Before you install.
Q · 01What exactly counts as a swing high?+
Q · 02What does swing strength change?+
Q · 03Why do broken levels stop instead of running on?+
Q · 04Does SidiSwing raise alerts?+
Q · 05Which NinjaTrader version does it need?+
Q · 06What do I get in the free demo?+
Read more
Naked VPOC Trading Strategy for Futures
Map unfinished auction references with a naked VPOC trading strategy for futures, using footprint, delta, imbalances, and session context in real time.
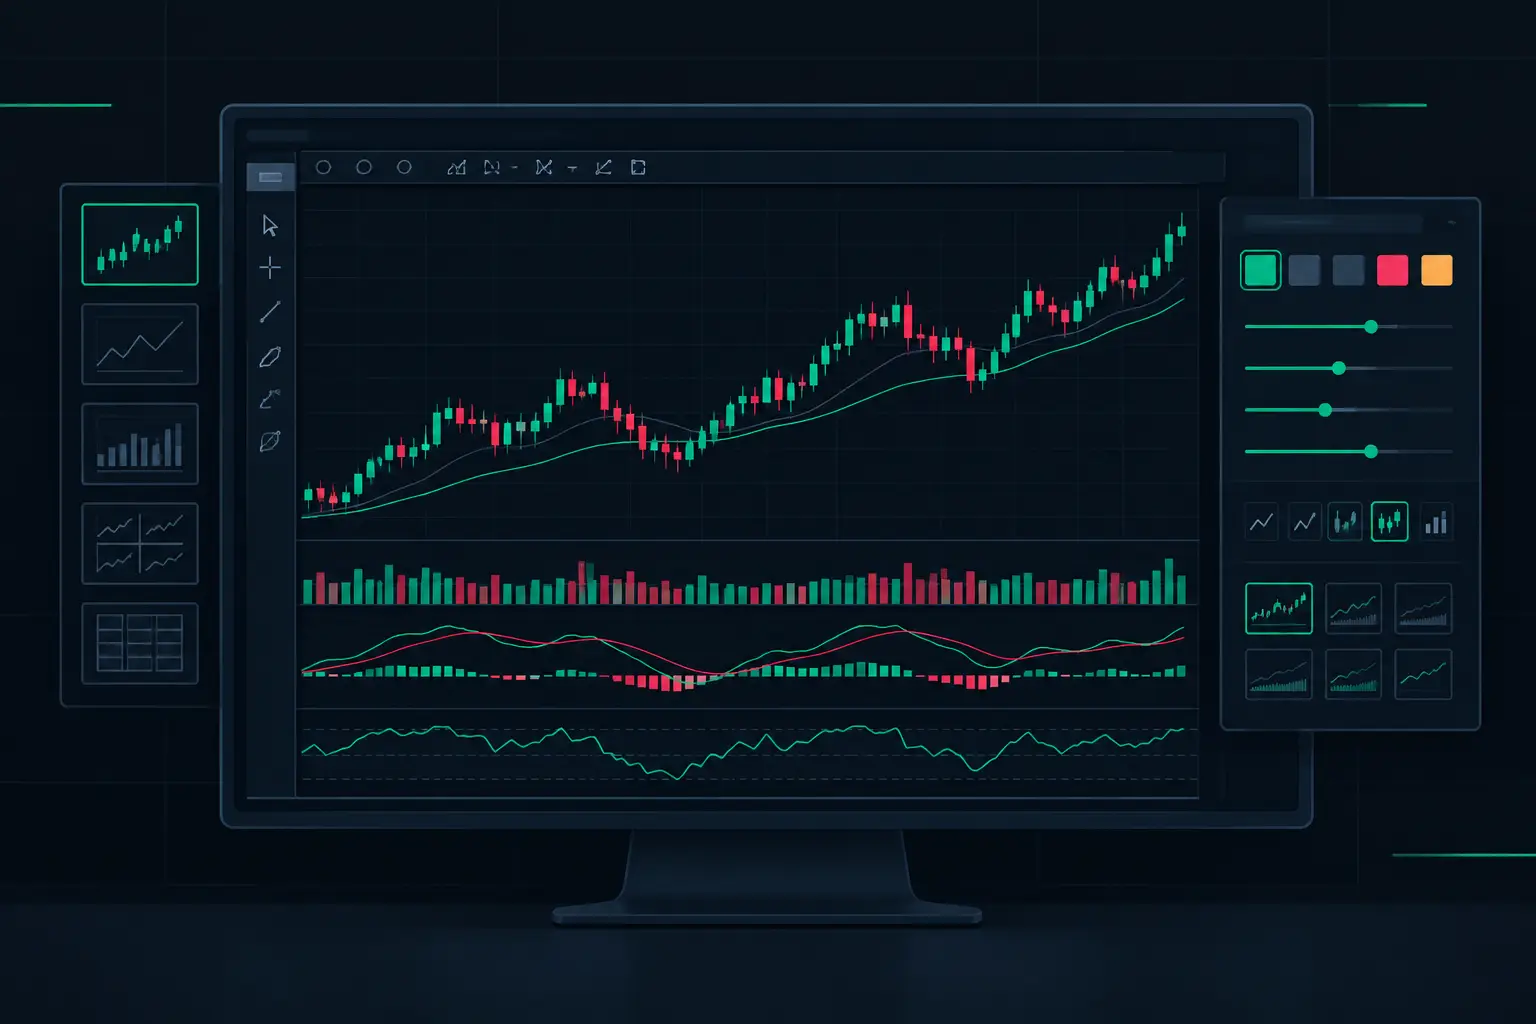
Best NinjaTrader Chart Customization Features
See the best NinjaTrader chart customization features for footprint, profiles, alerts, and fast order-flow context when ES auction speed increases at open.

NinjaTrader 8 Footprint Chart for Faster Reads
Build a NinjaTrader 8 footprint chart that exposes delta, imbalances, absorption, VPOC, and auction context when futures order flow accelerates fast.
See it on your own chart.
SidiSwing is unlocked in the free 14-day demo, together with every other Sidi tool for NinjaTrader 8.
Start free 14-day demo → All tools and prices