
Volume profile levels and VWAPs, in your own chart.
SidiVolumeLevels draws the two things a volume chart is read from: where the most volume changed hands, and what the average paid price is. Thirteen periods run side by side, and you rearrange all of it while the market is open.
What it puts on your chart
A price chart shows where the market went. It does not show where the volume went. Two sessions with the same high and the same low can be built completely differently underneath, and the difference only becomes visible once volume is counted at each price.
SidiVolumeLevels counts it and draws the result as lines. The volume profile side gives you the VPOC, the price that traded the most, plus the value area high and low that bracket the bulk of the session's volume. The VWAP side gives you the volume-weighted average price, the number that answers what the average participant in this window actually paid. Both are calculated for several periods in parallel, so a session reading and a weekly reading can sit on the same chart without being confused for one another.
Everything on the chart is a separate object with its own settings. A line, the short marker at the chart edge, and the label next to it are configured one by one, for every period, on both sides of the tool. That is where the 865 settings of version 3.5.0.0 go: not into more features, but into making the chart readable at a glance instead of readable after study.
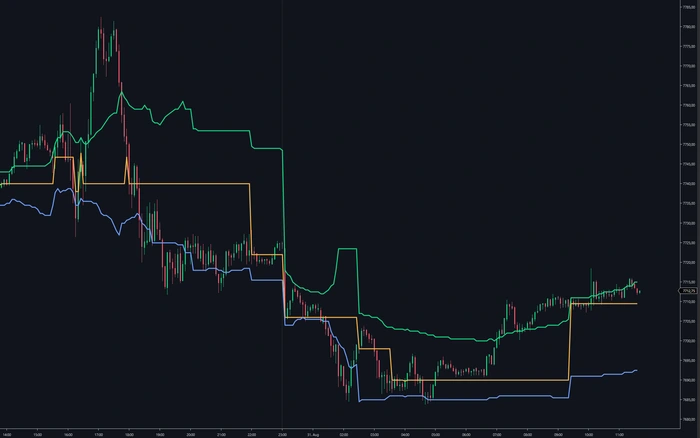
VPOC and the value area, for the period you pick
The volume profile counts traded volume at every price. Out of that distribution come two readings: the VPOC, meaning the single price that traded the most, and the value area, the band that holds the bulk of the volume. SidiVolumeLevels calculates both for five periods at once, and each one carries its own line, its own edge marker and its own label.
A VWAP that knows where your session begins
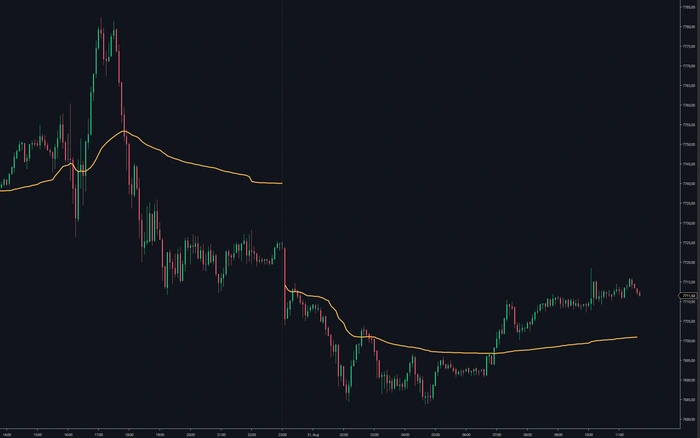
A VWAP is only as useful as the window it is calculated over. Each period has its own session setting: the full session, or a custom window with your own start and end time in one of twelve time zones, from exchange time to Tokyo. Set the reset period to two days and you get a two-day VWAP, without touching any other line.
Several periods on the same chart, told apart at a glance
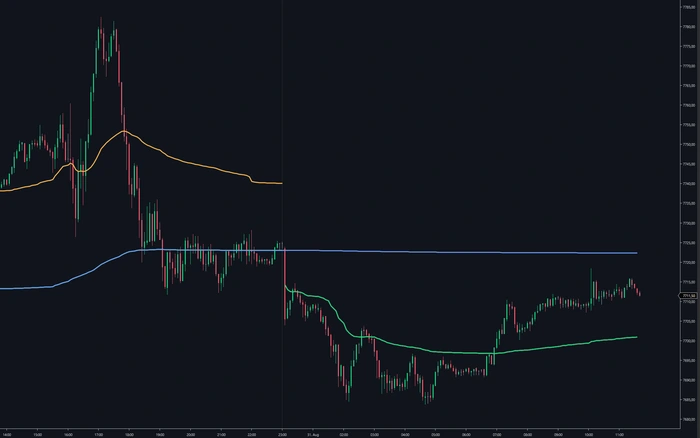
Eight VWAP periods run in parallel: two independent daily lines, weekly, monthly, one across the whole contract, and three you anchor yourself. Every line has its own dash style, width, opacity and colour mode, so a weekly line never reads like a session line.
What you can change.
865 settings in version 3.5.0.0, read out of the installed indicator. The list below is what they are for.
VWAP
- Eight periods calculated separately, two daily, weekly, monthly, contract and three anchored
- Reset period in days per line, so a 2-day or 5-day VWAP is one number, not a second indicator
- Full session or a custom window with your own start and end time
- Twelve time zones, from chart and exchange time to US, European and Asian sessions
- Visibility per line: every period, the running period only, or off
- Dash style, width in pixels and opacity for each line
- Four colour modes: flat, up/down, up/down/close, up/down/rising
- Edge marker with its own length, margin and dash style, left or right
- Label with free text, prefix, font, size and the optional live price next to it
- Marker mode Historical or Realtime, so old markers either stay while you scroll back or do not
Volume profile
- VPOC, value area high and value area low for five periods
- Two independent daily profiles, weekly, monthly and contract
- Each level with its own line, edge marker and label, configured separately
- Same period and session controls as the VWAP side
- Levels extend to the right edge on request
Alerts and notification
- One alert per level and per period, not one global switch
- Trigger once per bar, or every few seconds while the condition holds
- Reference point Open, High, Low or Close, on the finished or the unfinished bar
- Operator for the comparison: above, below, equal, or any crossing
- Your own .wav file per alert
- Spoken alerts through text-to-speech, with language, voice, rate and volume set once for the whole tool
- Email notification for events you would not see on the chart, such as a lost data connection
In the chart
- Realtime Settings window, opened from a button in the chart toolbar
- Indicator name row can be hidden to keep the chart clean
- Bar index at the mouse position for precise navigation
- Drawing order against other indicators, set by Z value
- Margin to the right chart edge
- Max Days To Load caps how far back the calculation reaches
- Logging to the NinjaScript output window, the Control Center log tab, or a file of its own
Thirteen periods, twenty-three levels, all at once
Most volume tools give you one profile and one VWAP. This one calculates thirteen periods in parallel and puts every resulting level on the chart as a separate object, with its own line, edge marker, label and alert. Nothing is shared, so a weekly level never inherits the look of a daily one.
VWAP
- Daily 1
- Daily 2
- Weekly
- Monthly
- Contract
- Anchored 1
- Anchored 2
- Anchored 3
Volume profile
- Daily 1 · VPOC, VAH, VAL
- Daily 2 · VPOC, VAH, VAL
- Weekly · VPOC, VAH, VAL
- Monthly · VPOC, VAH, VAL
- Contract · VPOC, VAH, VAL
Change it while the market runs
Most indicators make you close the settings dialog, reload the chart and look again. SidiVolumeLevels has its own Realtime Settings window, opened from a button in the chart toolbar. Colours, line styles, visibility and label text change in the chart as you set them, and the window saves, loads and resets complete presets from its bottom bar. Position and colour scheme of the window itself are yours to set.
A few fields change what is calculated rather than how it is drawn, and those still ask for a chart reload (F5). Everything visual answers immediately.
Pick your licence.
Every plan includes free updates. Secure checkout handled by Freemius.
One licence, any of your computers
The licence is tied to your email address, not to a machine ID. You can install SidiVolumeLevels on as many computers as you like and run it on one of them at a time.
Before you install.
Q · 01Does SidiVolumeLevels draw a market profile (TPO)?+
Q · 02What is the difference between Daily 1 and Daily 2?+
Q · 03Can I change the look without reloading the chart?+
Q · 04How far back does it calculate?+
Q · 05Can I get an alert when price reaches a level?+
Q · 06Which NinjaTrader version does it need?+
Q · 07What do I get in the free demo?+
Read more
Volume Profile Indicator for Faster Context
Use a volume profile indicator to map VPOC, value area, and high-volume acceptance across each futures session with precise auction context during RTH.
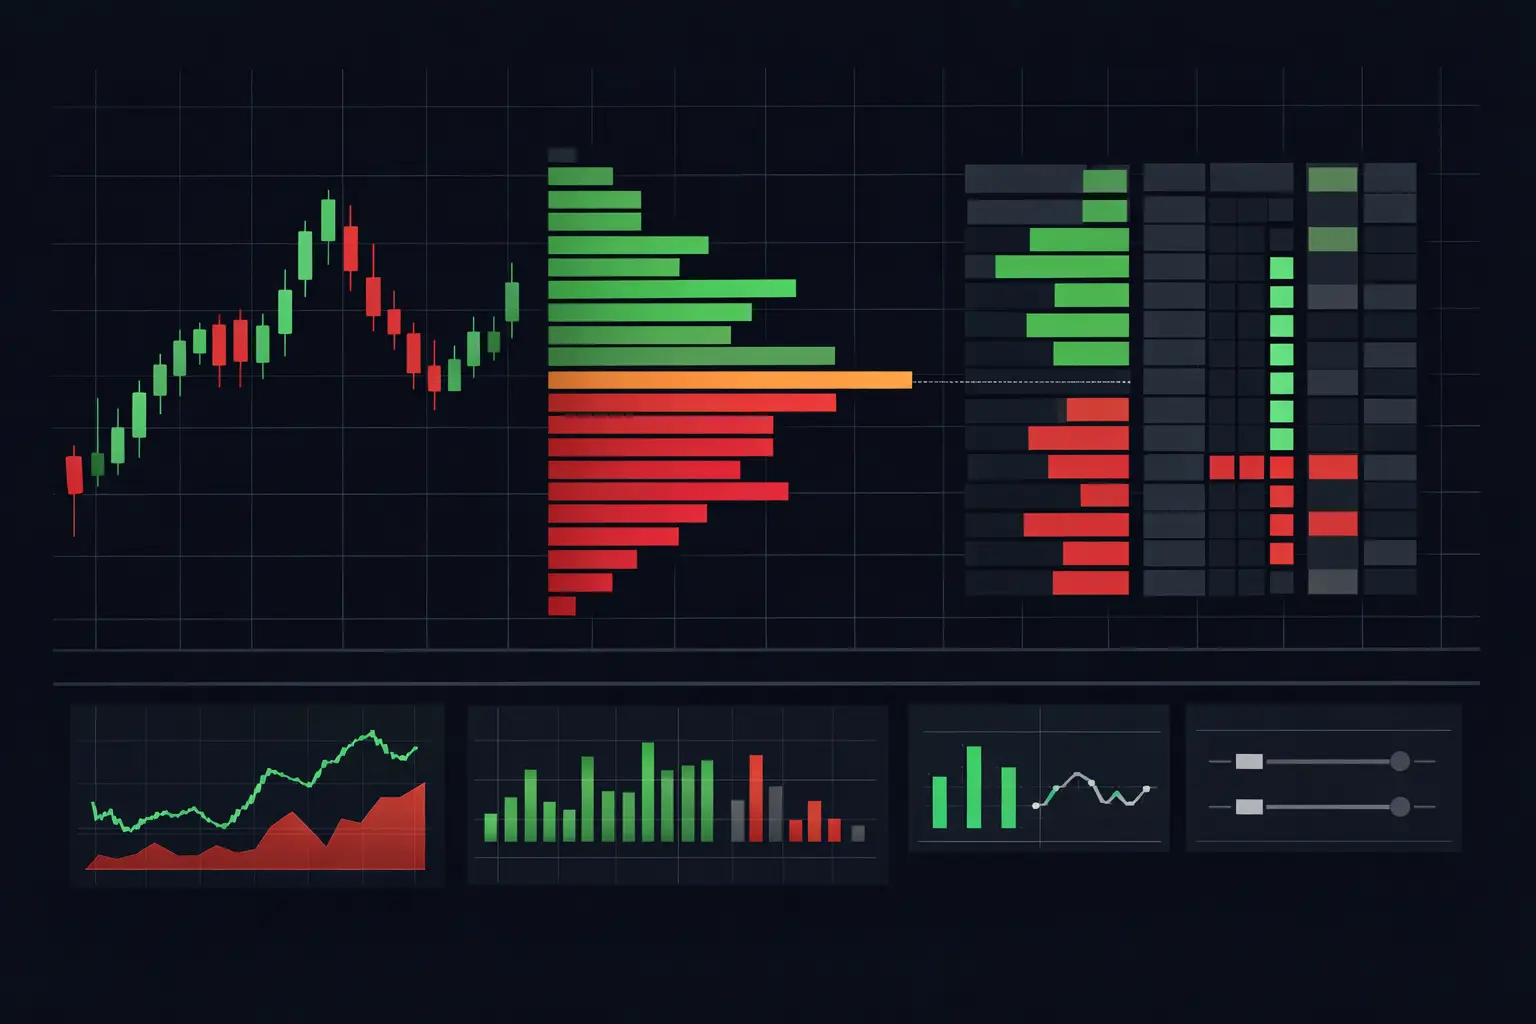
Session Volume Profile NinjaTrader Setup
Configure a session volume profile in NinjaTrader 8 to track VPOC, value area, developing distribution, and order flow at every price level with precision.
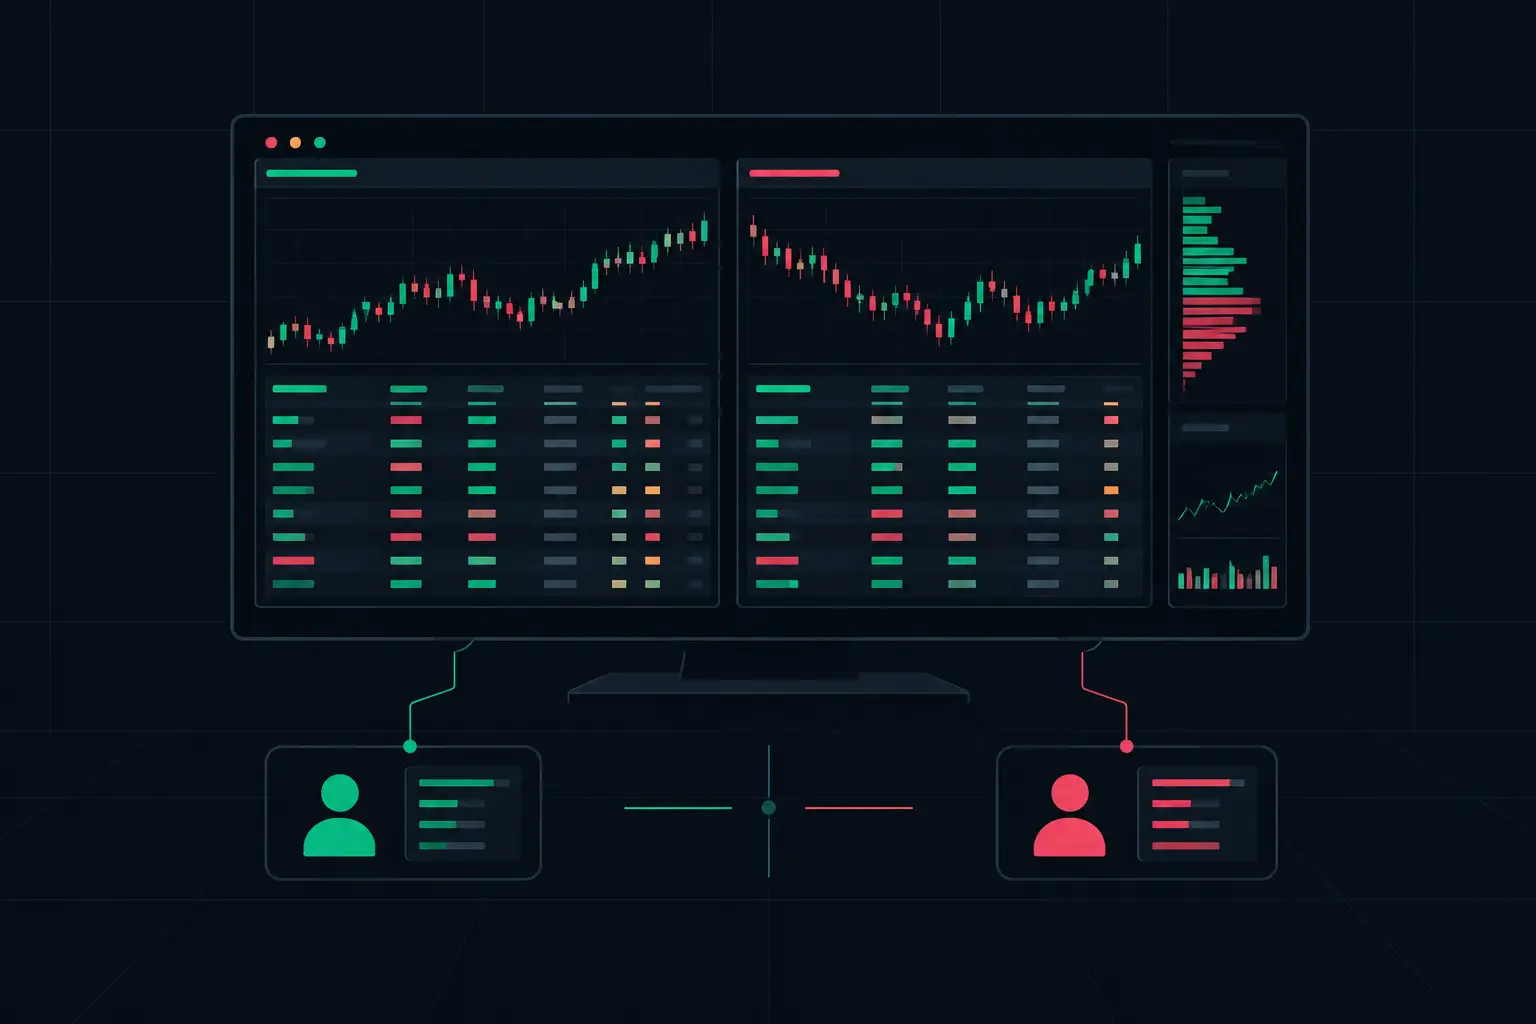
VPOC Versus Session POC and What Each Shows
VPOC versus session POC is a scope question. Learn how profile boundaries, developing volume, migration, and acceptance sharpen futures chart daily context.
See it on your own chart.
SidiVolumeLevels is unlocked in the free 14-day demo, together with every other Sidi tool for NinjaTrader 8.
Start free 14-day demo → All tools and prices