
Best Order Flow Heatmap Layouts for Futures
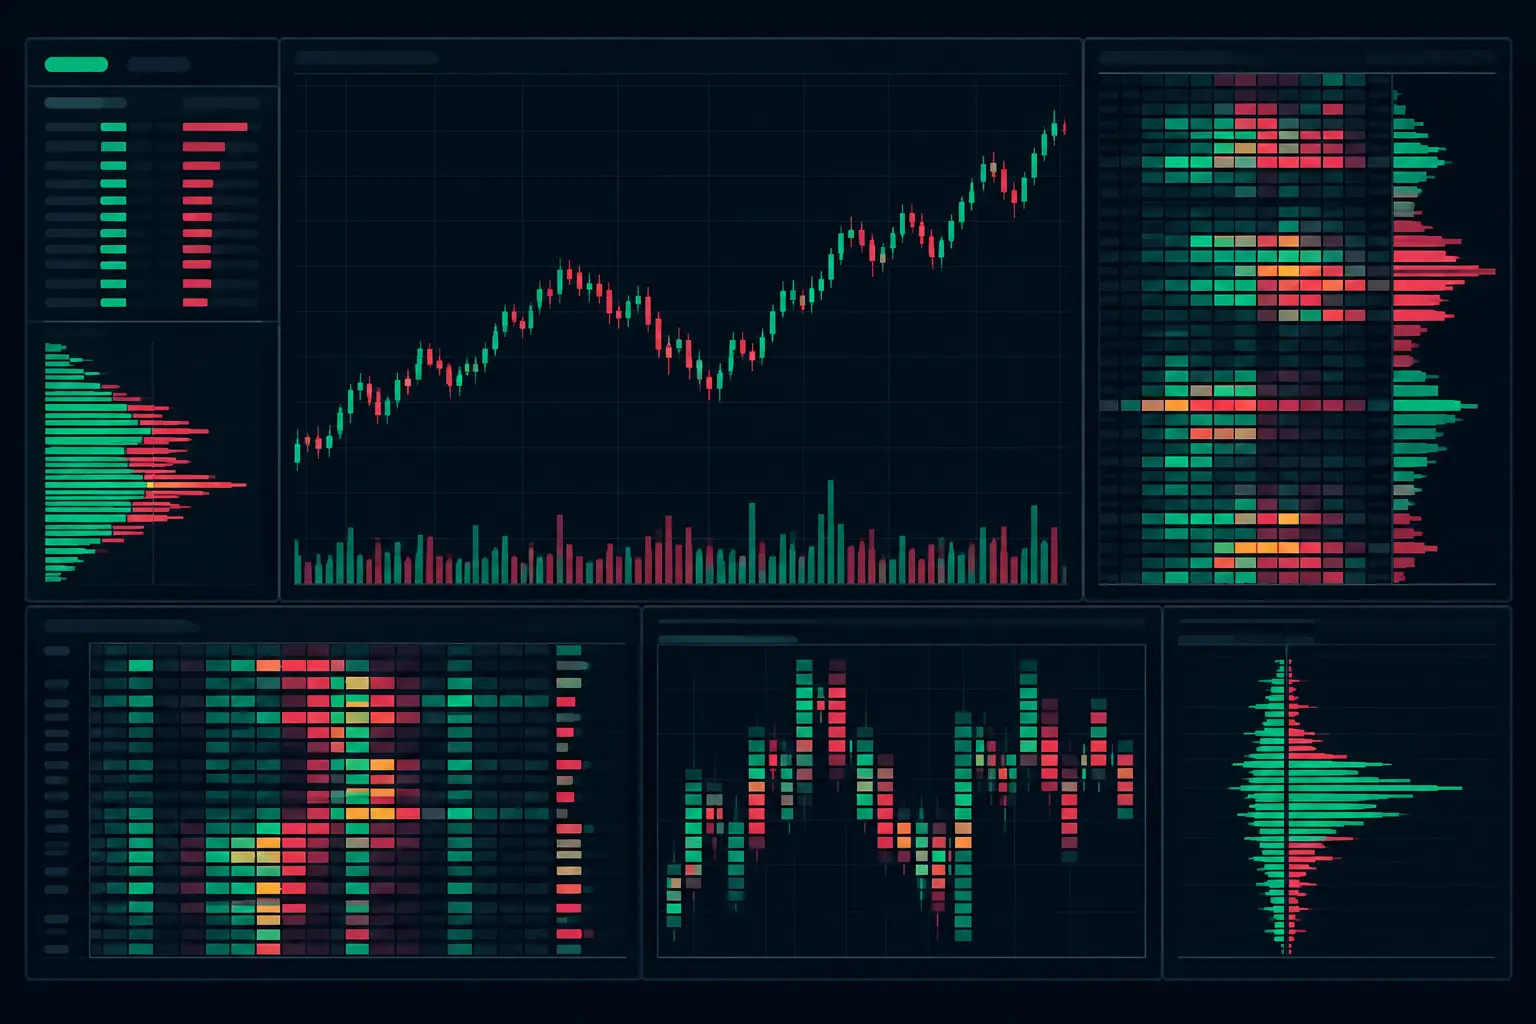
A heatmap earns its chart space only when it answers a question that the footprint cannot answer alone: where is displayed liquidity positioned, how long has it remained there, and what happens when aggressive volume reaches it? The best order flow heatmap layouts do not turn the chart into a wall of color. They separate resting liquidity from executed volume, preserve the developing auction, and keep the information readable when the E-mini S&P 500 is moving several levels in seconds.
Most traders either hide the heatmap behind a conventional bar chart or place it so prominently that every other layer becomes unreadable. Neither layout is built for execution-grade analysis. A useful layout gives each data type a job: the heatmap maps passive interest, the footprint records what actually traded, and profiles establish location within the session auction.
What a heatmap should show
A heatmap visualizes resting limit liquidity across price and time. High-intensity bands indicate larger displayed size relative to the chosen scale; lower-intensity areas indicate thinner displayed participation. That distinction matters because a large resting level is not the same thing as volume transacted at that level. One is available liquidity. The other is completed aggression.
The chart becomes more informative when those two facts remain visually independent. If a bright liquidity band is immediately covered by opaque footprint cells, the trader loses the ability to see whether liquidity held, pulled, reloaded, or was consumed. If the heatmap is too faint, its time-based behavior disappears precisely when the auction accelerates.
The right layout also depends on the question being monitored. A scalper tracking near-price liquidity needs a compressed view centered on the developing bar. A trader reading session structure needs more historical depth, a visible developing VPOC, and enough vertical range to see liquidity positioned outside value. One default layout cannot serve both jobs equally well.
Best order flow heatmap layouts by use case
1. The integrated footprint and heatmap layout
For active intraday futures charts, the most balanced configuration places a semi-transparent heatmap behind the footprint in the primary panel. The footprint remains the foreground object, with bid/ask volume, delta, diagonal imbalances, and bar VPOC readable at every price. The heatmap supplies the passive-liquidity layer without requiring a separate pane or a second chart.
Set heatmap opacity low enough that numeric cells, imbalance highlighting, and developing bars retain contrast. The correct setting is instrument- and color-scheme-dependent, but the operating rule is fixed: footprint text must be readable at a glance, while major resting bands must remain visible through the bar body. Use a restrained color ramp with a clear maximum-intensity state. Too many gradient steps create visual noise and make a moderate level look as important as a major one.
This arrangement is especially effective around session VPOC, prior value-area boundaries, and prominent intraday references. It lets the chart show the difference between an area where liquidity is displayed and an area where aggressive buyers or sellers are repeatedly transacting. Add a compact delta or volume profile column at the right edge rather than overlaying profile information across the footprint.
2. The liquidity-first execution layout
When immediate order-book behavior is the primary focus, widen the main panel and reduce the number of historical footprint bars in view. The goal is not to remove context. It is to reserve pixel space for the last several developing bars and the liquidity directly above and below current price.
In this layout, use a heatmap with a shorter historical persistence window and a more selective intensity threshold. Small, transient resting orders should not receive the same visual treatment as size that remains visible over multiple rotations. Keep the footprint in a narrower display mode, showing only the fields relevant to aggression: bid/ask volume, delta, and diagonal or stacked imbalance markers.
The layout becomes powerful when paired with an absorption view. Suppose repeated ask-side volume prints into a bright overhead band while price stops advancing. The footprint documents the executed buying; the heatmap shows the resting liquidity absorbing it. If the bright band disappears before price reaches it, the chart records a different event: displayed liquidity was pulled, not tested. Those are structurally different conditions, and the layout must make both visible.
Avoid crowding this setup with a large session profile in the same panel. Move profile context to a slim independent column or a secondary panel. The near-price auction needs room.
3. The session-structure layout
A heatmap becomes more useful over a larger time horizon when it is framed by auction structure. Use a wider chart with fewer visual effects, a full-session volume profile, and a clearly marked developing VPOC. Place the profile in an independent right-side column so it never obscures heatmap bands or footprint prints.
This configuration is designed to show where passive liquidity is appearing relative to accepted and rejected areas. Liquidity clustering just outside the developing value area carries a different meaning than liquidity layered in the middle of a balanced distribution. The chart should preserve enough vertical range to keep both visible at the same time.
Use longer heatmap persistence in this layout. A level that remains displayed through multiple rotations deserves more attention than a brief flash close to price. At the same time, do not use persistence as proof that size will remain. Displayed orders can be modified or canceled. The heatmap is a record of visible intent over time, not a promise of future behavior.
A dual-profile configuration can add precision here. One profile can track the current session while a second tracks a defined composite or a separate time window. This separates the current auction from the broader distribution without forcing both ideas into one overloaded profile. SidiFootprint supports independent profile columns, allowing the structural reference to stay visible while the heatmap and footprint remain clean.
4. The exhaustion and absorption layout
This layout prioritizes the relationship between aggressive execution and price response. Keep the heatmap behind the footprint, but use highly selective highlighting for stacked imbalances, unusually high volume at price, and bar-level delta extremes. Add a compact cumulative delta study below the primary panel only if it can be read without shrinking the footprint beyond usefulness.
The purpose is to identify a mismatch: expanding aggressive volume with limited price progress, or a rapid price move occurring through thin displayed liquidity. In the first case, absorption may be present. In the second, the heatmap can show the absence of meaningful resting size in the path of price.
Color discipline matters more than feature count. Let the heatmap own one visual dimension - liquidity intensity. Let footprint cell colors communicate executed imbalance or delta. Let profile colors communicate value and VPOC. When every layer uses bright red, green, yellow, and blue, the chart becomes a color contest rather than an analytical tool.
Configure the hierarchy before the colors
The best layouts are built from a visual hierarchy, not a checklist of studies. Start with price and footprint data as the first layer because they record the completed auction. Place the heatmap behind them as the passive-liquidity layer. Put profiles at the side, where they provide location without covering execution data. Reserve the lower panel for cumulative delta only when it answers a question not already visible in the footprint.
Then tune three controls: scale, persistence, and opacity. Scale determines what qualifies as meaningful displayed size. A scale that is too sensitive paints every book fluctuation; a scale that is too strict hides the levels shaping the immediate auction. Persistence determines how much history remains on screen. Opacity determines whether layers cooperate or compete.
Do not use a fixed scale across instruments and sessions. Liquidity behavior in ES during regular trading hours is not visually proportional to a thinner futures market or to overnight conditions. Normalize the display to the instrument's usual order-book behavior, then validate it during both fast and rotational periods.
Keep the chart readable when the tape accelerates
Fast conditions expose weak layouts immediately. Footprint text begins to overlap, heatmap colors saturate, profiles consume the right edge, and the trader is left watching a chart that contains everything but communicates little.
Reduce clutter before adding more studies. Limit the visible footprint fields to the information used in the current workflow. Use abbreviated numbers where appropriate. Keep only major imbalance highlights. Preserve a defined visual gap between the last traded price and right-side profile columns. If the developing bar cannot be read without zooming, the layout is too dense.
A heatmap should remain useful even when the chart is viewed for one second. Major liquidity bands should be obvious. Executed aggression should be distinguishable from resting size. The developing VPOC and value references should be locatable without searching. That is the standard for a layout built for live order flow, not for a screenshot.
Build the heatmap around the question you need answered at that moment, then remove every layer that competes with the answer. When passive liquidity, executed volume, and auction location each have a defined place on the chart, fast price action becomes far easier to read without turning the workspace into noise.
See it on your own chart.
Every Sidi tool is unlocked in the free 14-day demo. Install SidiFootprint in NinjaTrader 8 and load one of the finished color styles to start.
Start free 14-day demo → SidiFootprint features Browse color stylesRelated articles

NinjaTrader 8 Footprint Chart for Faster Reads
Build a NinjaTrader 8 footprint chart that exposes delta, imbalances, absorption, VPOC, and auction context when futures order flow accelerates fast.
Best NinjaTrader Chart Customization Features
See the best NinjaTrader chart customization features for footprint, profiles, alerts, and fast order-flow context when ES auction speed increases at open.
Stacked Imbalance Trading Strategy for Futures
Build a stacked imbalance trading strategy for futures with footprint context, delta, VPOC, absorption, and developing auction structure in real time.