
Trade Count Indicator: Read Aggression by Price
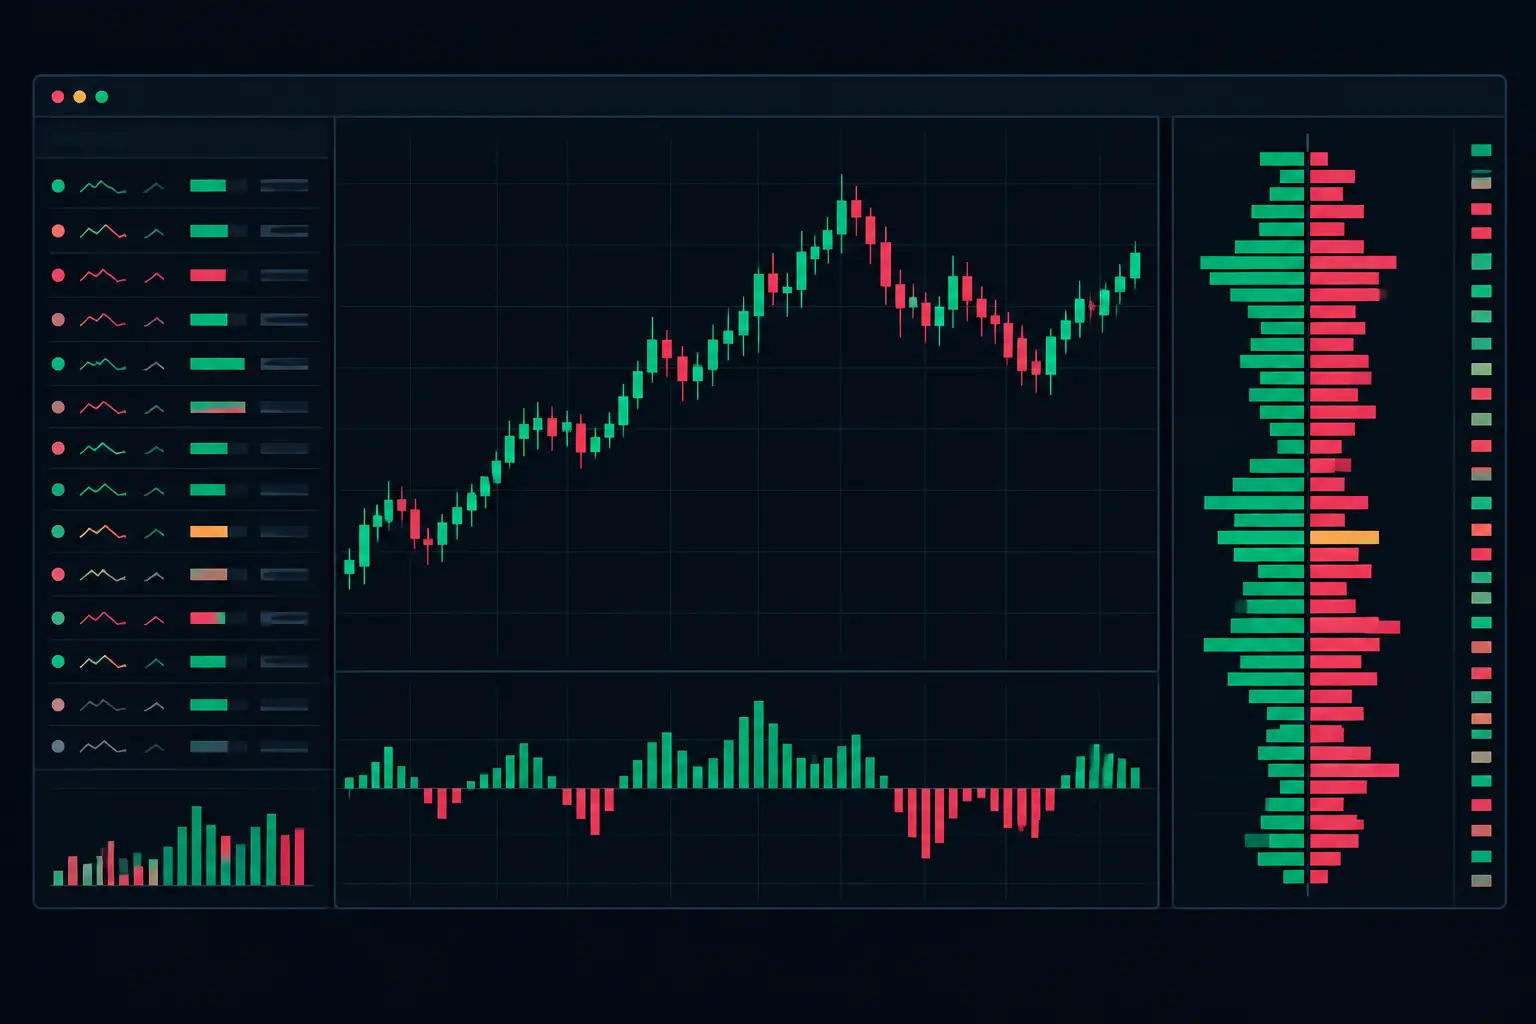
Most traders see a high-volume bar and assume broad participation. That assumption can fail fast. A trade count indicator separates contracts traded from the number of executions that created them, exposing whether activity at a price came from repeated smaller hits, fewer larger transactions, or a mix of both.
For active futures traders, that distinction matters most at inflection areas: a developing VPOC, the edge of value, a prior session extreme, or a price level where aggressive volume keeps pressing without extending the auction. Volume shows quantity. Trade count shows frequency of engagement. Read together at each price level, they add structure to the footprint instead of another aggregate number below the chart.
What a Trade Count Indicator Measures
A trade count indicator records the number of individual executions occurring at a given price during a bar, session, or selected profile period. On a bid/ask footprint, count can be displayed separately for executions classified at the bid and executions classified at the ask.
This is not the same measurement as volume. If 1,000 contracts trade through ten executions, the count is ten. If the same 1,000 contracts trade through 200 executions, the count is 200. The total volume is identical, but the auction behavior is not.
That difference becomes visible when the market reaches liquidity. A price may print heavy ask volume with a relatively low ask trade count, suggesting that a smaller number of larger aggressive executions did the work. Another price may print the same ask volume across a high count of smaller executions, showing sustained repeated interaction with available offers. Neither condition has a universal meaning in isolation. Context decides whether the activity is acceptance, rotation, absorption, or a brief burst through thin liquidity.
The count is only as precise as the underlying trade data and its execution reporting. A footprint must classify trades consistently and preserve enough granularity to organize them by price and aggressor side. For that reason, traders should verify how their NinjaTrader 8 data feed delivers bid/ask and market-by-order information before interpreting small count differences as meaningful structure.
Why Count Changes the Footprint Read
A conventional candle compresses the entire auction into open, high, low, and close. Even a volume-only footprint can conceal whether a price was reached through persistent interaction or concentrated size. Trade count restores one layer of that missing detail.
Consider two ES price levels with 500 contracts traded at the ask. At the first level, the ask column contains 12 trades. At the second, it contains 110 trades. The first print may reflect concentrated execution size. The second shows far more frequent aggressive participation, with the market repeatedly lifting offers at that price.
Now place those observations next to delta and price response. If ask-side count expands, ask volume expands, and price continues to auction higher, the footprint is showing active participation with extension. If ask-side count and volume expand but price cannot move above the level, the same aggressive activity is meeting passive supply. That is the operational value of count: it helps distinguish what traded from how the market responded after it traded.
Count is especially useful when total volume appears ordinary. A sharp rise in execution frequency can develop before a bar looks exceptional on aggregate volume. During a fast auction, that increase may reveal intensified interaction around a level long before the candle closes or a session profile materially shifts.
Count, Volume, and Average Trade Size
The cleanest way to use count is as part of a three-part read:
- Volume shows how many contracts exchanged.
- Trade count shows how many executions occurred.
- Average trade size approximates the relationship between the two.
Average trade size is not a replacement for the footprint. It is a compression of the same information. A high volume-to-count relationship points to larger average execution size, while a low relationship points to more fragmented activity. The actual bid/ask cells still matter because they show where that activity occurred and which side initiated it.
A count-based read should also account for the instrument and session. ES during the cash session, overnight index futures, and thinner contracts can produce very different count distributions. A threshold that highlights meaningful activity in one environment may color nearly every active price in another. Static settings without session context create noise.
Configure Trade Count by Auction Context
The best count display is not necessarily the most colorful one. It is the one that lets the eye identify changes in participation without obscuring delta, volume, imbalances, and profile references.
Start with the footprint layout. Trade count can be positioned as its own bid/ask pair, placed beside volume, or used as a secondary text field within a compact cell. A dedicated count column provides the clearest comparison during active conditions. A combined layout preserves horizontal space when the chart already includes volume, delta, and dual profile columns.
Next, define the coloring logic. Absolute thresholds can highlight any price level exceeding a specified number of executions. Relative thresholds are often more adaptive because they compare count to the bar, session, or recent distribution. A relative approach is useful when activity changes materially between the opening rotation and later session periods.
Then determine whether count should color the text, the cell background, or both. Text coloring is lighter and works well in dense footprints. Background coloring makes count events obvious at speed, but it can overpower imbalance markers and make developing bars harder to read. Keep one visual priority for each condition. If stacked imbalances already use strong color, count may work better as a text intensity scale or a restrained highlight.
SidiFootprint supports deeply configurable footprint columns, enabling trade count to sit alongside the information that gives it meaning: bid/ask volume, delta, VPOC, value area, and profile development. The point is not to display every available metric. It is to organize the chart so a change in execution frequency can be checked against location, aggressor side, and price response without moving between disconnected tools.
Read Trade Count at Important Locations
Count becomes most useful at locations already defined by the auction. A number printed in the center of a balanced range is usually less informative than the same number at a session high, opening range edge, low-volume area, or developing value boundary.
At a developing VPOC, sustained two-sided count can confirm that the market is doing business at that price. If the VPOC continues to build while price rotates through it, count helps show whether the center of trade is active and broad or dominated by a smaller set of larger executions. That distinction can improve the read of whether the session is building acceptance or merely pausing.
At the edge of value, compare count expansion with the ability of price to remain outside the area. Repeated ask-side executions above value with limited upward progress can expose passive offers absorbing aggressive buyers. Repeated bid-side executions below value with limited downward progress can show the opposite interaction. The footprint does not reduce this to a single conclusion. It shows the auction mechanics that candles hide.
At prior highs and lows, count can also separate a quick touch from a genuine engagement event. A level may trade through on low count and low volume, then immediately return. Another may attract dense count on both sides as liquidity is tested repeatedly. The latter deserves more chart attention because the market is visibly spending time and execution activity there.
Pair Count With Imbalances and Delta
Diagonal imbalances compare ask volume at one price with bid volume one tick below, or bid volume with ask volume one tick above. They identify a volume asymmetry between aggressive participants. Trade count adds another question: how frequently did that aggression occur?
A stacked ask imbalance accompanied by elevated ask count suggests repeated aggressive lifting across successive prices. A stacked imbalance with low count but substantial volume may be driven by fewer larger executions. Both can produce the same imbalance pattern, but they describe different execution texture.
Cumulative delta provides the broader directional record, while count explains participation density inside the bar. When cumulative delta rises but count contracts, the activity may be becoming more concentrated. When both delta and count expand, the auction is showing broader aggressive engagement. Check price response in either case. The chart should be read as a connected structure, not a collection of colored conditions.
Avoid the Common Count Errors
The first error is treating trade count as a proxy for volume. It is not. A high count with light total volume can be meaningful during fragmented interaction, while low count with heavy volume can reveal concentrated execution. Keep both columns visible when studying a new market condition.
The second is comparing raw count values across incompatible bar types. A 30-minute footprint, a 2,000-volume chart, and a range bar organize the auction differently. Count thresholds should be calibrated to the bar construction and session behavior, not copied across layouts.
The third is overreacting to isolated highlighted cells. One elevated count print can occur during ordinary rotation. The more useful question is whether count persists across adjacent prices, aligns with imbalance or delta, and changes the pace or location of the auction.
Finally, do not let the count display bury the levels that organize the session. VPOC, value area, prior references, and volume nodes provide the map. Trade count shows the intensity of interaction on that map.
A well-configured count column gives the footprint a sharper read of participation: not just how much traded, but how the market got there. When the tape accelerates, that distinction keeps the chart anchored to executed activity at the exact prices where the auction is being decided.
See it on your own chart.
Every Sidi tool is unlocked in the free 14-day demo. Install SidiFootprint in NinjaTrader 8 and load one of the finished color styles to start.
Start free 14-day demo → SidiFootprint features Browse color stylesRelated articles
Futures Auction Analytics at Each Price Level
Futures auction analytics reveals the bid/ask interaction, delta, volume, and acceptance behind every developing futures auction in real time as it forms.
Bid Ask Delta Versus Volume on Footprints
Bid ask delta versus volume explains who traded aggressively, where participation concentrated, and how footprint context changes price-level analysis.
Reading POC Migration Charts in Futures Markets
Reading POC migration charts reveals where accepted volume shifts, helping futures traders separate initiative auctions from rotational trade in real time.