
Volume Profile Versus Delta Profile Explained
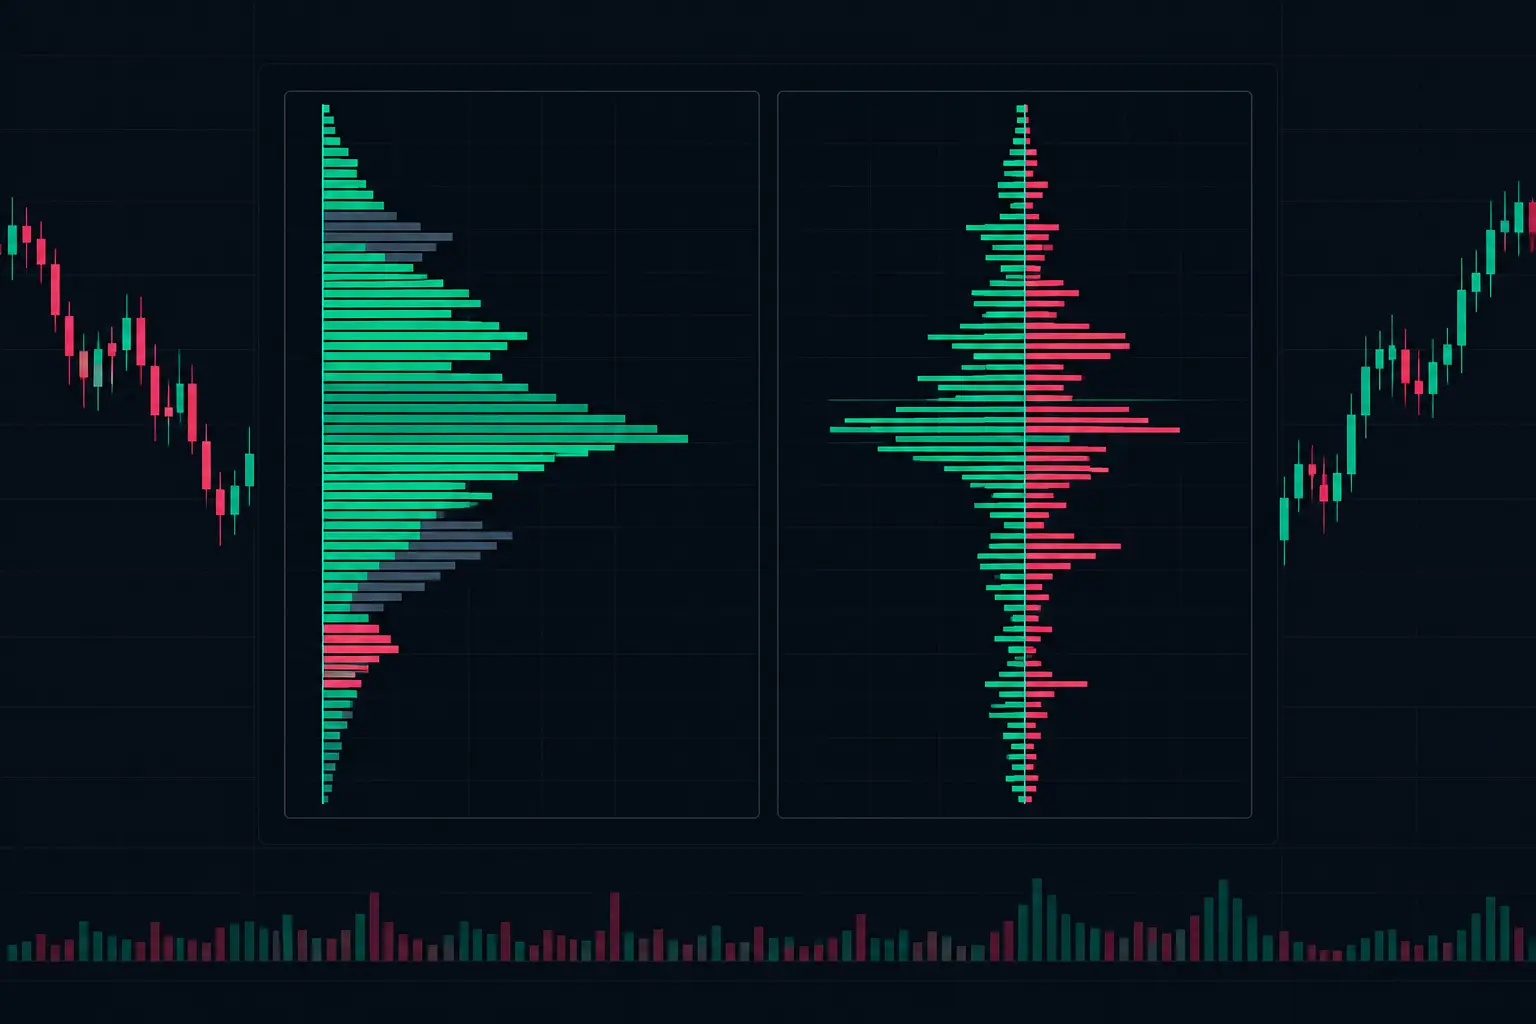
A 30-minute ES bar can close near its open while concealing a major shift in participation. Heavy volume may have accumulated at one price, while aggressive market buyers repeatedly lifted the offer at another. A standard candle compresses both events into a body and two wicks. Volume profile versus delta profile separates them: one maps where business occurred, while the other measures which side initiated it.
That distinction matters when the tape accelerates, rotates through a prior value area, or tests a developing VPOC. Volume alone identifies participation. Delta adds the aggression behind that participation. Neither replaces the other, and neither should be read in isolation.
Volume Profile Versus Delta Profile: The Core Difference
A volume profile distributes total traded volume across price levels. If 12,000 contracts trade at 5,240.00 in ES during a selected session, that total is assigned to the 5,240.00 row regardless of whether the transactions occurred at the bid or ask. The result is an auction map: high-volume nodes, low-volume areas, VPOC, and value-area structure.
Delta profile distributes the difference between volume executed at the ask and volume executed at the bid across those same price levels. Ask volume minus bid volume produces delta. A positive reading indicates more aggressive buying activity at that level; a negative reading indicates more aggressive selling activity.
The profiles can agree, but they answer different questions. Volume profile asks, "Where did the market conduct the most business?" Delta profile asks, "At each price, which aggressive side was more active?"
A high-volume price can have nearly neutral delta. That usually means both sides were active, with aggressive buyers and sellers transacting in relatively balanced size. A lower-volume price can show extreme positive or negative delta, revealing a concentrated burst of market-order aggression without the broad two-way acceptance seen at a high-volume node.
What Volume Profile Reveals About the Auction
Volume profile is structural. It shows where the auction spent time conducting business and where it moved quickly through thin participation. Its usefulness comes from location and shape, not from a single bar reading.
The VPOC marks the price with the greatest total volume in the profile. When it develops near a prior reference, it can show that participation is concentrating around an established auction level. When it migrates, it shows where the current auction is building acceptance. Value area provides the broader zone that contains the selected percentage of profile volume, while low-volume nodes often define fast-travel areas between larger distributions.
A session profile can show whether ES is building a balanced distribution, extending away from an opening range, or accepting a new price zone. Composite profiles add a larger context by showing volume structure across several sessions. The calculation remains simple, but the practical reading depends on whether the profile is developing, complete, balanced, or asymmetric.
Volume profile does not identify who was aggressive. A large node may reflect repeated initiative buying, repeated initiative selling, passive absorption on both sides, or a rotating two-way auction. It shows the footprint of participation, not the bid/ask imbalance inside that participation.
High Volume Is Not Directional by Itself
Traders often overstate the meaning of a high-volume node. High volume means contracts traded. It does not, by itself, establish whether aggressive buyers controlled the interaction, whether passive offers absorbed them, or whether price was accepted above the node afterward.
For example, ES may trade substantial volume at a session high while delta remains strongly positive. If price cannot continue higher and begins rotating back through the node, the relevant observation is not simply that volume was high. The observation is that aggressive buying met enough passive supply to contain the auction. Volume shows the location of the interaction; delta shows the initiating pressure that arrived there.
What Delta Profile Adds to the Picture
Delta profile brings bid/ask execution into the same price-by-price framework. It exposes whether market participants were more active lifting offers or hitting bids at each level. This is particularly useful around value-area boundaries, prior VPOCs, session extremes, and low-volume transitions where the response to aggressive activity matters.
Positive delta at a price means ask-side volume exceeded bid-side volume. Negative delta means bid-side volume exceeded ask-side volume. The magnitude matters, but context matters more. A large positive delta reading inside a mature high-volume node has a different character than the same reading at the edge of a developing range.
Delta can also be accumulated across a bar, session, or user-defined period as cumulative delta. That view helps track the running imbalance of aggressive activity while price develops. A rising cumulative delta with a stalled auction can expose absorption. A falling cumulative delta while price holds a level can show the same dynamic from the other side.
Delta is not a directional verdict. Aggressive buyers can be active while passive sellers absorb every lift. Aggressive sellers can repeatedly hit bids while passive buyers hold the level. The chart must show both the aggression and the price response.
Delta Requires Reliable Bid/Ask Classification
Delta profile depends on correctly classifying trades at the bid and ask. Its interpretation is only as useful as the underlying market-by-order or bid/ask data and the platform's processing of that data. In fast conditions, execution-grade visualization matters because delayed or overloaded displays can make developing bars difficult to read when the auction is moving.
A configurable footprint chart is useful here because it places bid volume, ask volume, delta, total volume, and imbalances at the actual price level. Instead of comparing separate panels after the fact, the trader can inspect how aggression developed inside the bar and where it met passive liquidity.
Reading Both Profiles at the Same Reference
The strongest use case is not choosing one profile over the other. It is aligning them at the same auction reference.
Consider a test of a prior session VPOC. Volume profile tells you that the price was a major prior area of business. As the current session trades into it, delta profile shows whether market buyers or sellers are initiating the test. The footprint then shows whether that aggression is extending through the level, being absorbed, or rotating within it.
If a low-volume node sits between two high-volume distributions, volume profile identifies the area as structurally thin. Delta can show whether the move through that area is driven by sustained one-sided aggression or whether bid/ask activity quickly balances. If price reaches the next high-volume node and delta expands but price stops progressing, absorption becomes the more relevant condition than raw directional delta.
This is why a dual-profile layout can be more informative than a single histogram. A total-volume column preserves auction structure. A delta column reveals the execution imbalance at the same prices. With independent profile columns, traders can position both views beside the footprint and maintain visual alignment without switching studies or compressing the chart.
A Practical Configuration Framework
Start by defining the profile period before adjusting colors or thresholds. A session profile is often appropriate for intraday auction structure, while a composite profile can provide larger context. For delta, decide whether the relevant view is per-bar delta, a profile over the same session, or cumulative delta across the chosen period.
Then align the key references. Display VPOC and value area from the volume profile, and use delta profile or footprint delta at those prices. Keep the price-row granularity appropriate for the instrument's tick size and current activity. Over-aggregating can hide the exact price where absorption occurs; excessive detail can make a fast chart visually dense.
For active futures workflows, visual hierarchy is operational. Total volume should make high-volume nodes obvious at a glance. Delta coloring should distinguish positive and negative aggression without obscuring the numbers. Imbalance settings should be selective enough to highlight meaningful stacked imbalances rather than paint every active bar with noise.
SidiFootprint supports separate profile columns alongside bid/ask footprint data, which allows volume structure and delta distribution to remain visible in the same chart workspace. The point is not to add more studies. It is to keep the auction map, aggressive participation, and price response aligned while the bar is still developing.
Where Traders Misread the Comparison
The common error is treating volume profile as slow context and delta as fast confirmation, as if the two tools operate on separate time horizons. Both can be calculated over the same session, bar, or custom range. The difference is informational, not temporal.
Another error is treating positive delta as automatically bullish and negative delta as automatically bearish. Delta measures market-order aggression, not whether that aggression moved price efficiently. When aggressive activity fails to produce continuation, the passive side is part of the story. That is where absorption, exhaustion, and the response around profile references become more informative than the delta number alone.
A third error is ignoring developing structure. A completed profile is clean, but the developing VPOC, expanding value area, and shifting delta distribution show how the auction is forming in real time. Watching those elements update can reveal whether volume is building at a new price or merely revisiting an old one.
Use volume profile to establish where the auction found participation. Use delta profile to inspect the aggressive activity inside that structure. When both are anchored to the same prices, the chart stops reducing the session to candles and begins showing the actual mechanics of the auction.
See it on your own chart.
Every Sidi tool is unlocked in the free 14-day demo. Install SidiFootprint in NinjaTrader 8 and load one of the finished color styles to start.
Start free 14-day demo → SidiFootprint features Browse color stylesRelated articles
Delta Divergence Charts for Faster Auction Context
Delta divergence charts expose disagreement between price and aggressive volume, helping futures traders read absorption, exhaustion, and auction context.
How Unfinished Auction Order Flow Reappears
Unfinished auction order flow shows where the previous auction stopped short. Read unfinished extremes with footprint, delta, VPOC, and session context.
NinjaTrader Indicators for Order Flow Control
NinjaTrader indicators turn bid/ask activity into real-time chart context. Configure footprint, profile, delta, and alerts for active futures markets.