
Developing VPOC Meaning on Footprint Charts
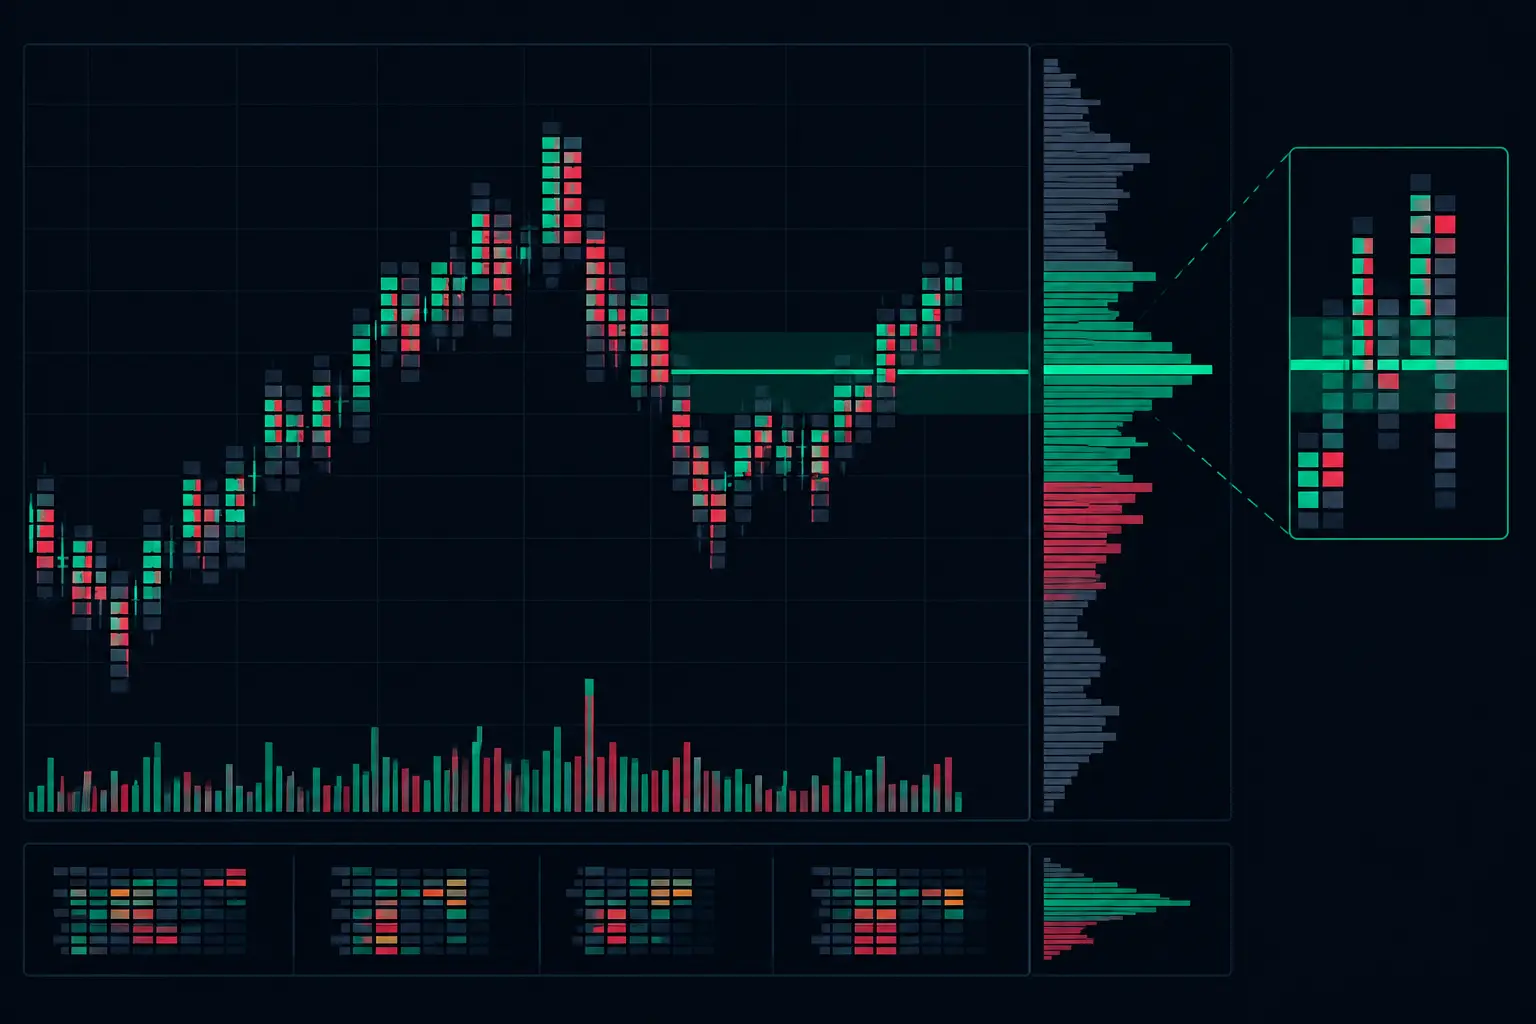
A static VPOC tells you where the most volume accumulated after an auction is complete. A developing VPOC shows where that concentration is forming while the auction is still active. That distinction is the core of developing VPOC meaning: it is not merely a horizontal line updating on the chart. It is a live record of where participation is concentrating as bid and ask activity continues to print.
For active futures traders, the useful question is not simply, “Where is the VPOC?” It is whether the developing VPOC is holding, migrating, accelerating, or repeatedly being displaced. Each behavior describes a different volume-distribution process. Footprint data adds the necessary detail by showing what traded at the prices surrounding that evolving control point.
What a Developing VPOC Measures
VPOC stands for Volume Point of Control: the price level with the greatest traded volume within a defined profile. The profile can represent a session, a custom range, a developing bar, or another selected aggregation. As new volume enters the profile, the price with the highest cumulative volume can change. That current leader is the developing VPOC.
The calculation is straightforward. Volume is accumulated at each price level. The platform identifies the price with the largest total. If another price exceeds it as the auction develops, the VPOC relocates. What matters operationally is that the line can move without price traveling far. Heavy two-way activity at one price can build enough volume to pull the developing VPOC there even during a relatively narrow rotation.
A developing VPOC is therefore not a directional label. It is an auction-location metric. It shows where the market has spent the greatest amount of executed volume so far within the chosen profile period.
Developing VPOC Meaning Depends on Its Behavior
A developing VPOC that remains fixed while price rotates around it describes concentrated acceptance. The market continues to transact heavily at the same location, and that price retains control of the volume distribution. On a footprint chart, this often appears as repeated high-volume prints, balanced bid/ask participation, and sustained activity through the same price area.
A VPOC that steps higher or lower describes a changing center of volume. The step itself is not enough to explain the auction. Review whether the movement is accompanied by initiative volume, stacked imbalances, expanding delta, or simply a new pocket of two-way trade. A quick migration on limited participation has a different structure from a migration built through sustained aggressive execution.
There is also a meaningful difference between gradual and abrupt relocation. A gradual shift can reflect an auction building volume across adjacent prices. An abrupt shift can occur when a newly active price rapidly surpasses the prior volume leader. The footprint makes this visible at the price level rather than leaving the trader with a line whose movement has no context.
Fixed VPOC and Rotating Price
When price moves away from a fixed developing VPOC but the VPOC does not follow, the original price continues to hold the largest volume concentration. That may happen because the move away has not generated enough volume at any new price to replace it.
This is where volume alone needs support from order-flow detail. Examine the path away from VPOC. Are there thin prints and limited trade counts, or is the footprint showing broad participation at each new level? Is delta expanding, or does aggressive activity fade into passive liquidity? The VPOC remains anchored, but the quality of the movement around it determines the larger auction read.
Migrating VPOC and Acceptance
When the developing VPOC follows price, the market is doing more than briefly visiting new territory. It is building enough traded volume at new prices to change the profile's control point. The sequence matters. A series of VPOC migrations in one direction can show a developing distribution whose center is relocating rather than remaining centered at the opening area.
Still, the profile setting defines the meaning. A developing session VPOC carries the accumulated context of the entire session. A developing bar VPOC resets with each bar and is much more granular. Neither is inherently better. Session VPOC is useful for the broader intraday auction; bar-level VPOC is useful when monitoring where volume is concentrating inside a short-term rotation.
Read the VPOC With the Profile, Not in Isolation
A VPOC is one point within a distribution. Its value rises when it is read beside value area boundaries, high-volume nodes, low-volume areas, and the profile shape. A developing VPOC near the center of a balanced profile means something different from one forming at the edge of a stretched distribution.
If the developing VPOC stays near the middle while the value area expands on both sides, volume is organizing around a central zone. If it shifts toward an edge while volume continues to build there, the distribution itself may be relocating. If price travels through a low-volume area and the VPOC remains distant, the chart is distinguishing travel from acceptance.
This is exactly where separate profile columns are useful. One profile can track the developing session distribution while another isolates a custom range or current bar. The comparison shows whether immediate volume is agreeing with the larger session structure or developing independently from it.
Add Footprint Evidence at the Control Price
Volume profile identifies where activity accumulated. Footprint data identifies how it accumulated. At a developing VPOC, inspect bid volume, ask volume, delta, total volume, and trade count together.
High total volume with relatively balanced bid and ask execution can indicate sustained two-way interaction. Large negative delta at the VPOC with price holding above or around that level can expose aggressive selling meeting passive buy-side liquidity. Large positive delta that fails to lift price through nearby levels can reveal the opposite interaction. These are not standalone conclusions. They are the execution details that explain why a volume concentration is persisting or shifting.
Absorption and exhaustion tools add another layer. Absorption near a developing VPOC can show that aggressive orders are being met without immediate price displacement. Exhaustion can show a reduction in participation as price reaches or leaves a key volume location. Used alongside the profile, these conditions help separate a busy price from a price where one side is actively absorbing the other.
Configure the Reference Before You Interpret It
The most common error with developing VPOC is treating every line as if it represents the same auction. It does not. The profile's start and end conditions, volume mode, session template, and reset logic control what the line measures.
For intraday futures work, first decide whether the reference should be session-based, range-based, or bar-based. Then keep that reference stable long enough to compare behavior across similar conditions. A session VPOC that resets according to the intended trading hours preserves continuity. A custom profile anchored to a specific event or balance area isolates that auction. A developing bar VPOC provides immediate detail but intentionally carries less history.
Visual settings matter as well. The line should be distinct enough to remain visible during fast movement without obscuring footprint numbers. Labeling the current price and extending the developing level can improve location awareness, while color and line style can distinguish it from completed VPOCs, value area levels, and other profile references.
SidiFootprint supports this kind of layered workspace by combining footprint columns with integrated profile analytics, allowing developing VPOC behavior to remain visible beside the bid/ask data that created it. The objective is not more chart decoration. It is to preserve the relationship between volume concentration and execution at each price.
When a Developing VPOC Is Most Informative
Developing VPOC becomes especially useful during transitions: when an opening range begins to distribute, when a prior balance is being revisited, when a fast directional move pauses, or when price begins rotating through a previously thin area. These are moments when candles can show movement but conceal whether volume is actually establishing a new center of trade.
The line is less informative when its construction period is poorly matched to the question being asked. A one-bar VPOC cannot replace session context, and a session VPOC can be too slow if the immediate objective is to inspect microstructure inside a developing bar. Keep both levels available when the chart layout supports it, but assign each a clear role.
A developing VPOC is most valuable when it stays connected to the auction that produced it. Watch where it forms, how long it holds, what replaces it, and what the footprint prints at the transition. That is how a moving volume line becomes execution-grade market context rather than another static chart reference.
See it on your own chart.
Every Sidi tool is unlocked in the free 14-day demo. Install SidiFootprint in NinjaTrader 8 and load one of the finished color styles to start.
Start free 14-day demo → SidiFootprint features Browse color stylesRelated articles
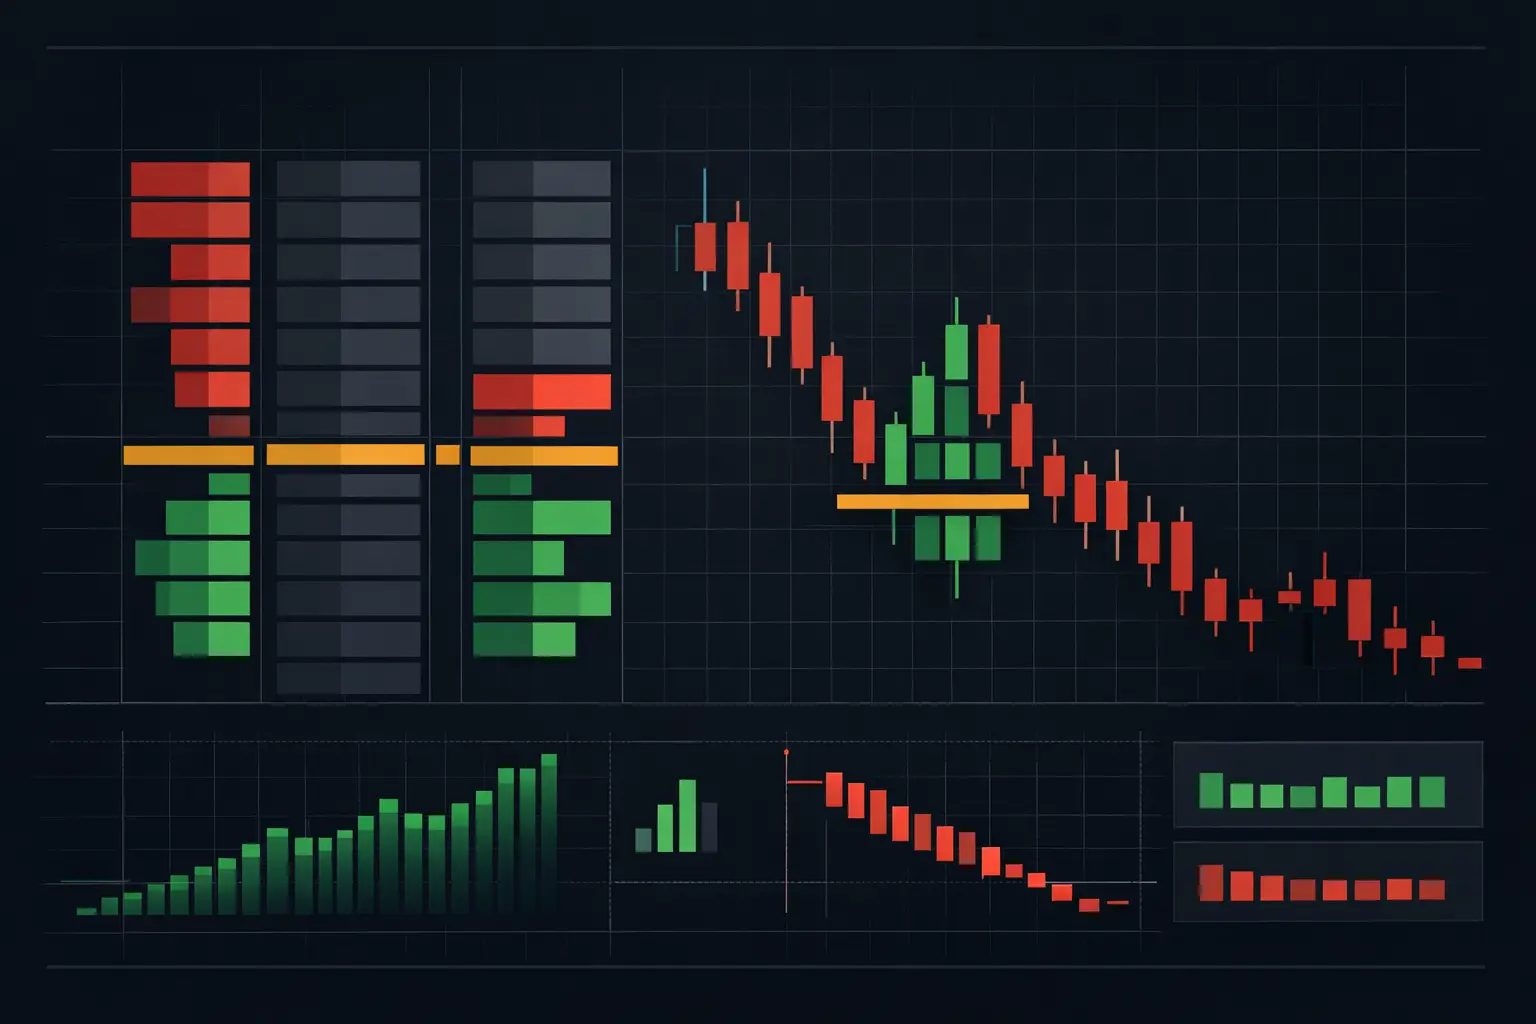
Stacked Imbalance Trading Strategy for Futures
Build a stacked imbalance trading strategy for futures with footprint context, delta, VPOC, absorption, and developing auction structure in real time.
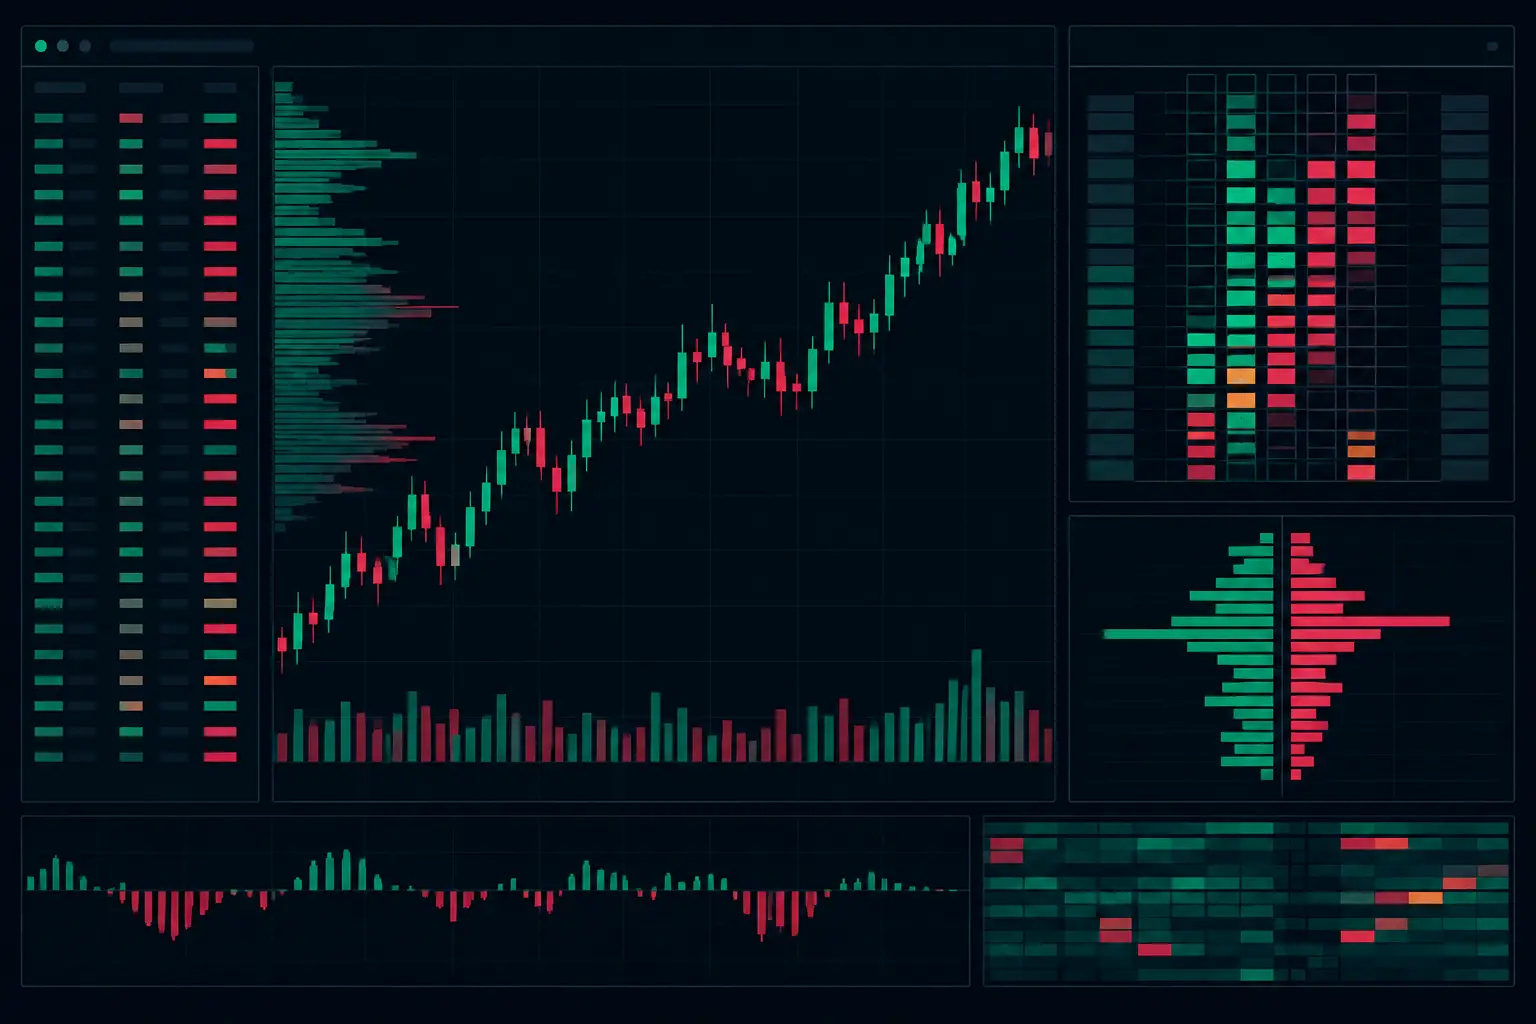
Futures Footprint Interpretation Guide for Traders
This futures footprint interpretation guide explains delta, imbalances, VPOC, absorption, and developing profiles for auction context in NinjaTrader 8.
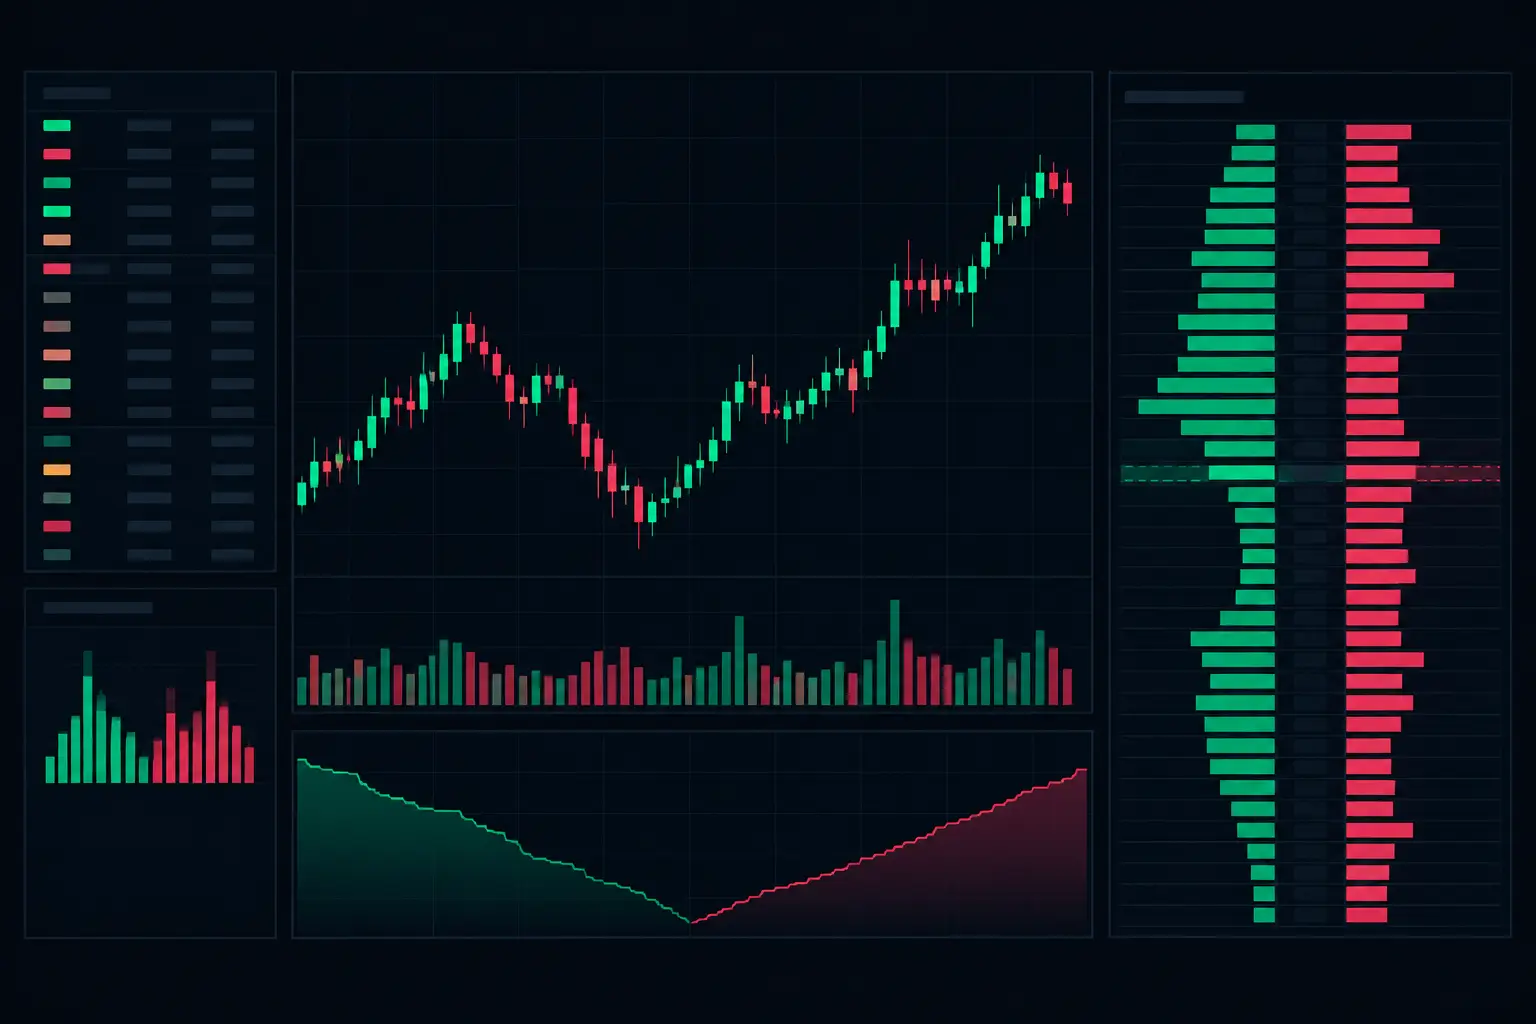
E-mini Bid Ask Visualization That Holds Up
See E-mini bid ask visualization at each price level, with footprint, delta, imbalances, VPOC, and profiles built for fast NinjaTrader 8 charts in motion.