
NinjaTrader Add-On Review for Fast Markets
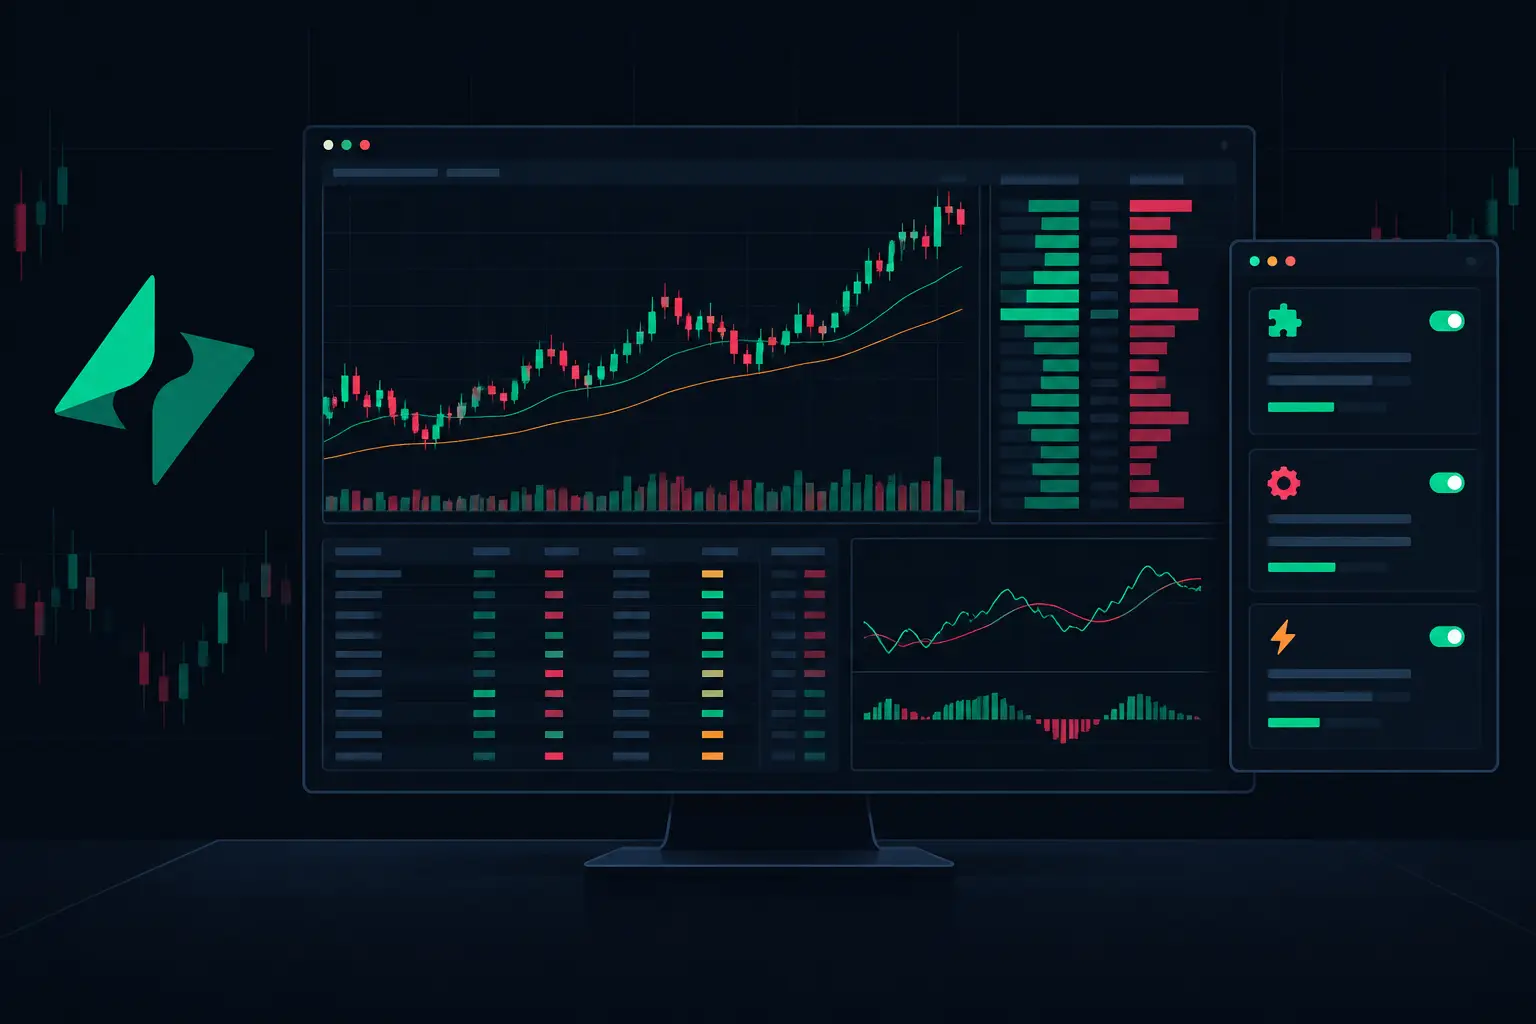
A footprint chart either keeps pace when the ES accelerates through a high-volume area, or it becomes another delayed layer between the tape and your screen. This NinjaTrader add-on review focuses on the criteria that matter under live market conditions: how accurately an add-on represents bid/ask activity, how much chart control it provides, and whether its display remains readable while developing bars update.
Most traders stare at candles and infer participation after the fact. An order-flow add-on should expose what actually traded at each price level: aggressive buying and selling, volume concentration, delta behavior, resting liquidity interactions, and the auction structure forming inside the bar.
What a NinjaTrader Add-On Review Should Measure
A serious review should not stop at a feature inventory. Nearly every order-flow tool can display numbers in a bar. The relevant question is whether those numbers are calculated, organized, and rendered in a way that supports fast visual interpretation.
Start with the underlying bid/ask classification. A footprint requires market-by-order or bid/ask data to separate volume executed at the ask from volume executed at the bid. That separation drives delta, diagonal comparisons, stacked imbalance logic, absorption displays, and cumulative delta. If the data is compressed, delayed, or visually obscured, the chart loses its purpose.
The calculation model also needs to be clear. A diagonal ask imbalance compares ask volume at one price with bid volume one tick below. A diagonal bid imbalance compares bid volume at one price with ask volume one tick above. This offset matters because it measures aggressive activity pressing into the opposing side of the book at adjacent prices. A configurable ratio and minimum-volume filter let the trader decide what qualifies as meaningful participation rather than marking every small print.
A useful add-on makes these rules visible in the settings, not hidden behind a fixed display. You should be able to control imbalance ratios, minimum volume, stacked levels, color treatment, text size, and whether the chart emphasizes bid volume, ask volume, delta, total volume, or trade count. The point is not to fill the screen with color. The point is to isolate the information that matches the auction behavior you are studying.
Footprint Speed Is a Charting Requirement
Performance is not a cosmetic specification. During a fast sequence of prints, a footprint chart must update developing bars, profiles, highlights, and alerts without forcing the trader to simplify the layout into something less useful.
This is where a NinjaTrader add-on review should test more than a quiet replay segment. Load several chart windows. Use a practical tick resolution. Enable the components that create real rendering work: footprint cells, developing VPOC, session profile, value area, cumulative delta, imbalances, and absorption markers. Then observe how the chart behaves when volume expands and multiple price levels update at once.
Latency is often experienced as visual hesitation rather than a dramatic platform failure. Text can lag behind price movement. A developing VPOC may appear to jump late. Profile columns can redraw unevenly. Dense cell formatting can become hard to read precisely when the market becomes active. These are operational constraints, not minor interface preferences.
SidiFootprint is engineered for this environment, with a stated 7x speed advantage and a rendering approach designed for high-density, real-time footprint work. That claim matters only if it holds with the features you actually use enabled. A proper evaluation should therefore reproduce your normal chart load rather than judging speed from a default template.
Profile Context Cannot Be an Afterthought
A footprint bar tells you how volume traded inside a narrow time or range segment. A profile tells you where that activity sits in the broader auction. The two views belong together.
Look for an add-on that can display volume-profile context without requiring a separate, fragmented workflow. VPOC should be available as a developing reference as well as a completed-session reference. Value area calculations should be configurable, and profile placement should not consume the same visual space needed for the footprint itself.
Dual independent profile columns are particularly valuable when comparing two forms of context on the same chart. For example, one column can show total volume distribution while another displays delta distribution. That arrangement can reveal a location where total activity is concentrated but directional aggression is not, or where delta expands away from the primary volume center. The chart should allow these columns to be positioned, sized, and colored independently.
Session boundaries also require control. Futures traders commonly need to distinguish regular trading hours from the broader electronic session, or examine a custom auction window. A fixed session template limits what the profile can explain. A flexible add-on lets the trader define start and end times, reset behavior, and the visual treatment of prior session levels.
VPOC and Value Area Need Precise Controls
The VPOC is the price with the highest volume in the selected profile. That definition is simple, but the useful implementation is not. A developing VPOC needs to update cleanly as new volume changes the distribution. Historical VPOCs need clear extension rules. Value area boundaries need to remain readable beside dense footprint cells.
Review whether these elements can be displayed selectively by session, whether line extension is configurable, and whether the profile uses enough horizontal resolution to show the distribution without flattening meaningful detail. A profile that looks tidy but conceals local structure is not providing enough context.
Absorption and Exhaustion Must Be Configurable
Absorption occurs when aggressive volume repeatedly trades into a price area but price does not extend as expected. Exhaustion describes a reduction in aggressive participation near the end of a move. Neither condition is a single number. Both require a relationship between volume, delta, price response, and location in the auction.
An effective add-on should let you define the thresholds that highlight these events. Minimum volume, delta thresholds, consecutive levels, and color rules should be adjustable. A one-size-fits-all threshold is rarely appropriate across instruments, sessions, and volatility conditions.
The visual treatment matters as much as detection. Absorption markers should not cover the footprint values that explain why the event was identified. Exhaustion highlights should remain distinguishable from imbalance colors. If every condition competes for the same bright palette, the chart becomes a notification wall instead of an analytical tool.
Alerts can extend visibility without changing the chart into a distraction machine. The best implementations allow precise conditions and support text-to-speech so attention can remain on the active workspace. Review whether alerts can be tied to stacked imbalances, delta conditions, profile levels, or absorption criteria, and whether they trigger only when the configured structure is genuinely present.
Configuration Depth Has to Remain Usable
More than 1,000 settings are valuable only when they are organized into a workable configuration system. Advanced traders need control over cell contents, fonts, colors, bar width, profile columns, imbalance logic, session behavior, and alert conditions. But they also need to find a setting quickly without rebuilding a chart from scratch.
Evaluate the settings hierarchy. Related controls should sit together. Defaults should create a functional footprint immediately, while deeper options should support specialized layouts. A trader running a compact scalping workspace has different requirements from someone studying multiple session profiles on a larger display. Both should be possible without compromising the clarity of the other.
Template behavior deserves attention as well. A carefully built footprint layout should be reproducible across instruments and chart intervals, with enough flexibility to adjust volume filters and visual scale where necessary. The add-on should preserve the logic of the layout, not merely copy its colors.
How to Test an Add-On Before Committing to a Layout
Use a full-featured demo period to test the same conditions you expect to analyze later. Begin with one footprint chart, then add developing profile elements, imbalance highlighting, VPOC, cumulative delta, and the alerts relevant to your workflow. Watch both normal rotation and fast directional auction periods.
Pay attention to whether the numbers remain legible at your preferred bar width. Test whether changing tick aggregation preserves the information you need. Compare a clean chart with a dense configuration, then remove any display element that does not add actionable context. The best layout is not the one with the most features enabled. It is the one that makes auction structure immediately visible.
Also inspect historical behavior. Completed bars should retain their profile and footprint formatting consistently, while developing bars should update without visual confusion. If a setting changes how historical and current bars are drawn, that behavior should be explicit.
A serious NinjaTrader add-on earns its place by showing the auction at the price level, maintaining clarity when activity expands, and giving the trader control over every relevant layer. Build the chart around the information you need to see first, then let the configuration support that view rather than overwhelm it.
See it on your own chart.
Every Sidi tool is unlocked in the free 14-day demo. Install SidiFootprint in NinjaTrader 8 and load one of the finished color styles to start.
Start free 14-day demo → SidiFootprint features Browse color stylesRelated articles
NinjaTrader Indicators for Order Flow Control
NinjaTrader indicators turn bid/ask activity into real-time chart context. Configure footprint, profile, delta, and alerts for active futures markets.
Order Flow Indicator Free Trial for NinjaTrader 8
Use an order flow indicator free trial to test footprint speed, bid/ask detail, profiles, and real-time configuration in NinjaTrader 8 futures markets.
How to Configure Footprint Cell Filters Fast
Configure footprint cell filters to isolate meaningful bid/ask activity, control color thresholds, and keep fast order-flow charts readable at speed.