
Orderflow Analytics for Faster Market Context
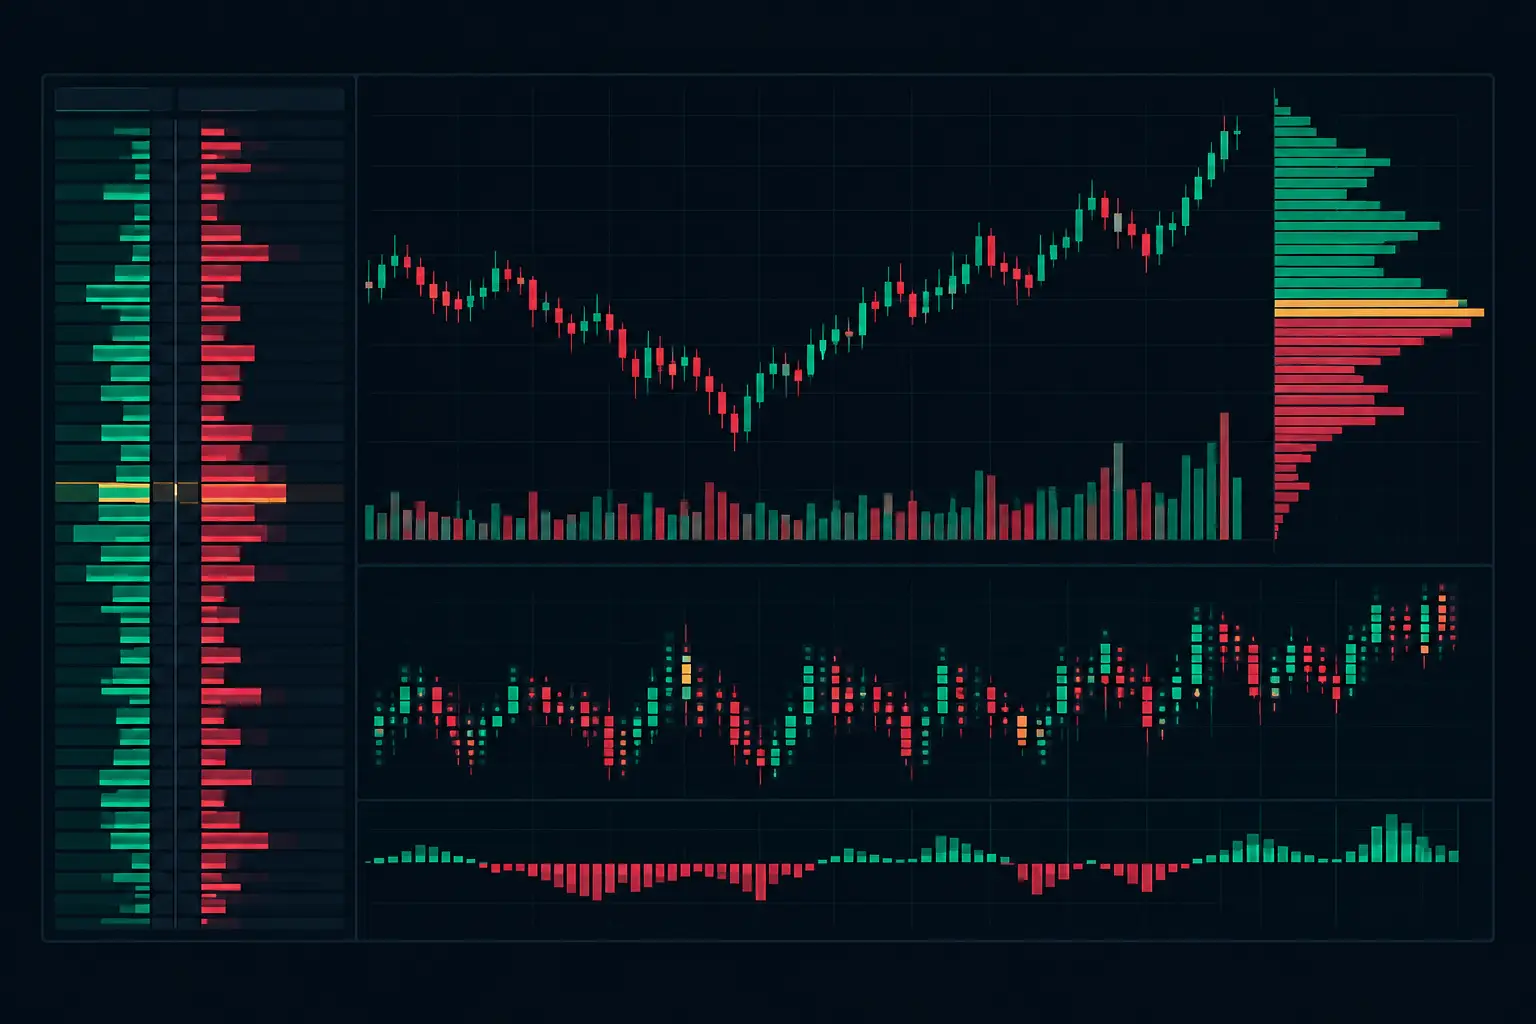
A five-minute candle can close green while aggressive sellers controlled most of the auction beneath it. It can close red while responsive buyers absorbed every wave of market-sell volume at a defended level. Orderflow analytics resolves that ambiguity by showing what actually traded at each price: volume at bid and ask, delta, trade count, imbalances, and the profile structure developing inside the bar.
Candles compress the auction into four values. That compression is useful for orientation, but it removes the interaction that matters when the market accelerates, rotates around a volume node, or tests a prior extreme. A footprint chart restores the auction at price level resolution. The question changes from “where did the candle close?” to “who initiated at this price, how much volume traded, and did price accept or reject that activity?”
What Orderflow Analytics Measures
Orderflow analytics is not a single metric. It is a framework for organizing market-by-order and bid/ask activity so the auction can be read without treating all volume as equivalent. Volume traded at the ask represents aggressive buying activity. Volume traded at the bid represents aggressive selling activity. The relationship between those values creates delta.
At any price, delta is ask volume minus bid volume. Positive delta means more volume lifted the ask; negative delta means more volume hit the bid. Delta becomes more useful when it is placed beside price response. Strong positive delta that cannot extend above a local high is different from positive delta that builds acceptance through successive higher prices. The same principle applies to negative delta at a low.
A professional footprint also separates volume from trade count. Large volume can come from a small number of substantial executions or from many smaller executions. Those are different auction conditions. Viewing both fields lets the trader distinguish concentrated participation from broad, repeated activity at the same price.
Bid/Ask Footprints and Diagonal Comparison
A bid/ask footprint places bid volume and ask volume beside each price row. That structure makes aggressive participation visible without forcing it into a separate lower panel. On a fast E-mini S&P 500 futures auction, the difference matters: the price level, the initiating side, and the bar structure stay in one visual field.
Diagonal imbalance calculations add another layer. Ask volume at one price is compared with bid volume one tick below. For the opposite condition, bid volume is compared with ask volume one tick above. This comparison follows the directional path of aggressor activity through the ladder rather than comparing values horizontally at the identical price.
A single imbalance may be ordinary auction noise. Multiple aligned imbalances form a stacked imbalance, which identifies sustained initiative activity through several price levels. The setting that matters is not merely whether imbalances are colored. Traders need control over the ratio threshold, minimum volume filter, stack length, colors, text presentation, and whether historical stacks remain visible after the bar closes.
Reading Price Response, Not Just Delta
Order flow becomes actionable context only when aggressive activity is evaluated against passive liquidity and subsequent price behavior. High ask volume at a high does not automatically mean the auction is strong. If the offer is replenished and price cannot hold above the level, the footprint may show absorption: aggressive buyers are active, but passive sellers are meeting that demand.
The inverse structure can appear at a low. Heavy bid volume may print while price stops extending downward, rotates, or builds acceptance above the level. The important observation is not that selling occurred. Selling always occurs. The question is whether it moved the auction or was absorbed by resting liquidity.
Exhaustion is a separate condition. Near an auction extreme, volume can thin sharply as one side stops initiating. A footprint chart can expose this through low-volume prints, diminishing trade count, and an extreme that lacks continuation. Exhaustion without context is not enough. It carries more weight when it occurs at a prior session high, low, value-area boundary, or composite profile reference.
Developing bars are central here. Waiting for a bar to close can remove the sequence that explains its final shape. During formation, traders can watch delta migrate, an imbalance stack appear or disappear, VPOC shift, and a previously active price level become inactive. The chart should update fast enough that this information remains usable while the auction is moving.
Volume Profile Gives the Footprint Structure
Footprints explain participation within a bar. Volume profiles explain where the market has spent volume across a session, range, or custom period. Combining the two prevents a common mistake: interpreting an isolated footprint event without knowing whether it occurred in the center of established value or at the edge of an auction.
The volume point of control, or VPOC, is the price with the greatest traded volume in the selected profile. A developing VPOC can migrate as the session builds. That migration shows where the auction is concentrating, while a static VPOC marks where the completed profile concentrated volume.
Value area adds context around the profile's principal volume distribution. When price rotates inside value, footprint activity often reflects two-way trade and responsive participation. When price moves away from value and begins building volume at new prices, the chart shows a different auction condition. No single setting can define that distinction. Profile period, value-area percentage, row size, and session template all affect the picture.
Dual independent profile columns are especially useful when two profile views are needed without sacrificing footprint detail. One column can display the developing session profile while another tracks a custom range, a prior session, or a composite distribution. That keeps the reference structure on the chart rather than forcing the trader to switch tools or layouts during active conditions.
Configure the Chart Around the Instrument
Orderflow analytics fails when the display is technically complete but visually slow to read. The correct configuration depends on tick size, typical intraday rotation, chart interval, and the trader's auction framework. A one-tick footprint can expose precise interaction in ES, but a larger aggregation may be cleaner when viewing broader rotations. More detail is not automatically better if it buries the structure.
Start with the fields that answer your immediate question. Bid/ask volume, delta, and volume are often the core. Add trade count when execution concentration matters. Add bar delta or cumulative delta when tracking participation across a larger sequence. Keep the row presentation consistent enough that changes in the auction are obvious rather than hidden by changing visual emphasis.
Color logic should carry meaning, not decoration. Configure imbalance thresholds high enough to filter routine prints, then use distinct treatment for stacked conditions. Set absorption and exhaustion displays so they identify defined auction behavior, not every busy price row. If the chart offers text-to-speech or visual alerts, reserve them for events that warrant immediate attention, such as a specified stack length, an absorption condition at a profile reference, or a developing VPOC change.
SidiFootprint supports this level of control with more than 1,000 configuration options, including independent profile columns, footprint fields, imbalance logic, value areas, and real-time event detection. The objective is not to turn every feature on. It is to build a layout that shows your required auction information without delay or visual conflict.
Speed Is Part of the Analysis
A footprint chart is only as useful as its behavior during high-volume conditions. If rendering lags, columns overlap, or developing information updates late, the display becomes a historical report instead of an execution-grade analytical tool. Performance is not cosmetic. It determines whether the chart preserves sequence when multiple price levels update in rapid succession.
This is also why modular configuration matters. A trader focused on stacked imbalances and session VPOC needs a different layout from one studying absorption at range extremes. Both require reliable bid/ask processing, but the display hierarchy should match the task. Adding every available statistic can create noise just as easily as using too little data can create blind spots.
The strongest order-flow workspace makes the market's negotiation visible at a glance: where initiative volume entered, where passive liquidity held, where volume accumulated, and where acceptance changed. Build the chart so those relationships remain clear when the tape moves quickly.
See it on your own chart.
Every Sidi tool is unlocked in the free 14-day demo. Install SidiFootprint in NinjaTrader 8 and load one of the finished color styles to start.
Start free 14-day demo → SidiFootprint features Browse color stylesRelated articles
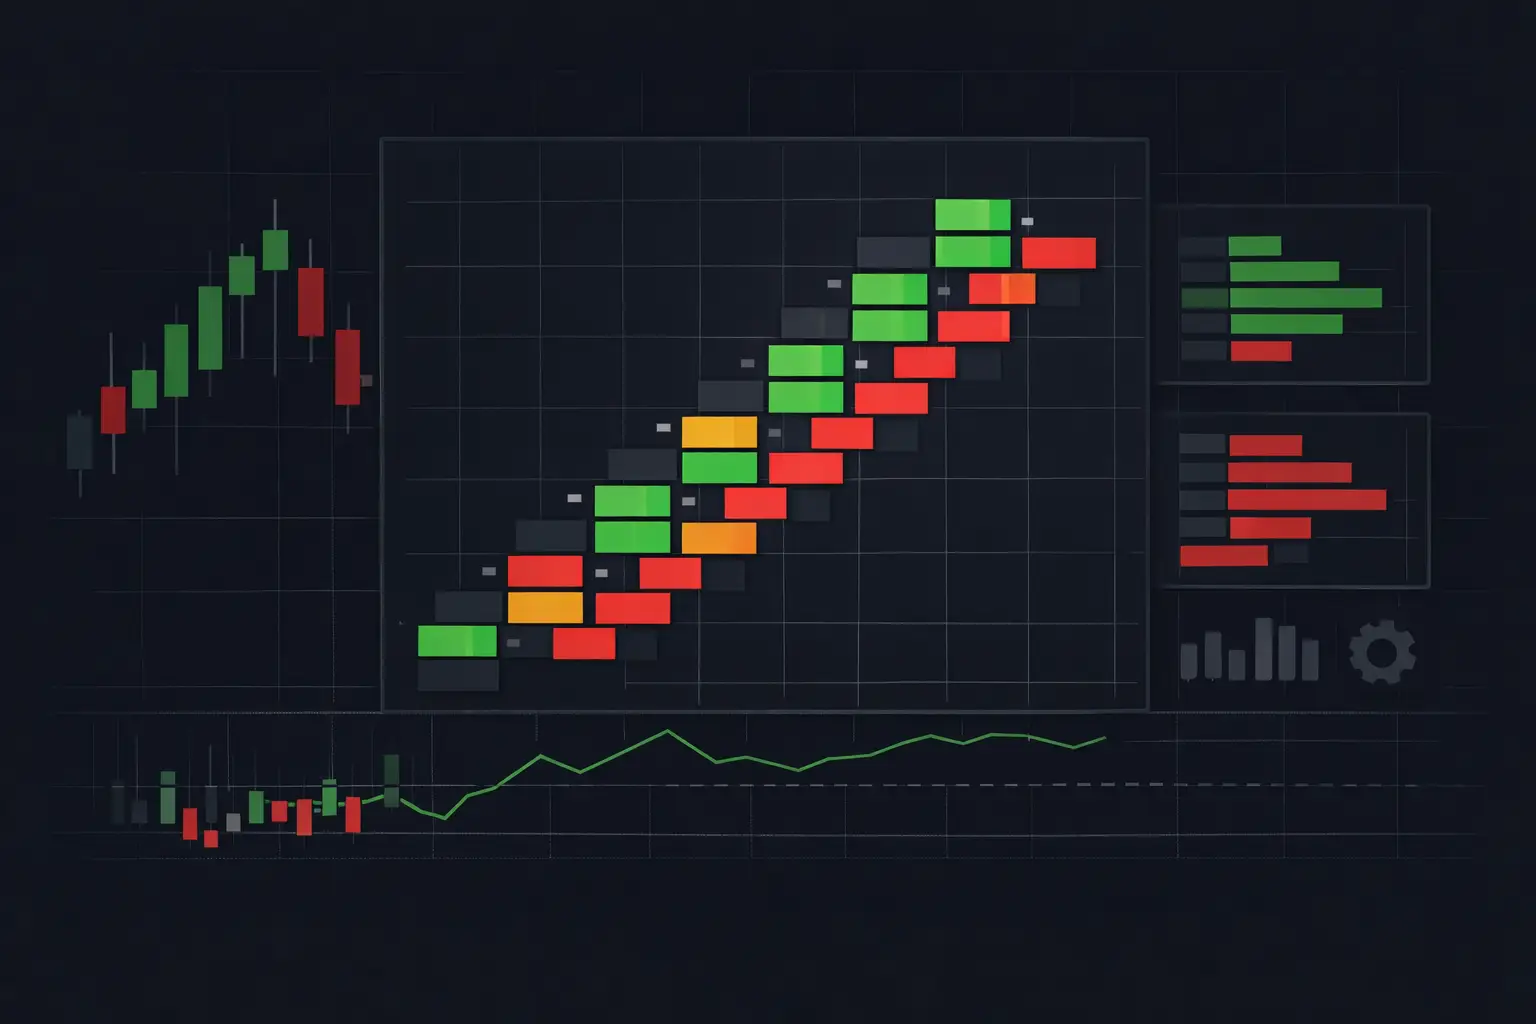
Diagonal Imbalance Footprint Chart Explained
A diagonal imbalance footprint chart exposes aggressive bid and ask activity price by price, giving futures traders precise auction context in real time.
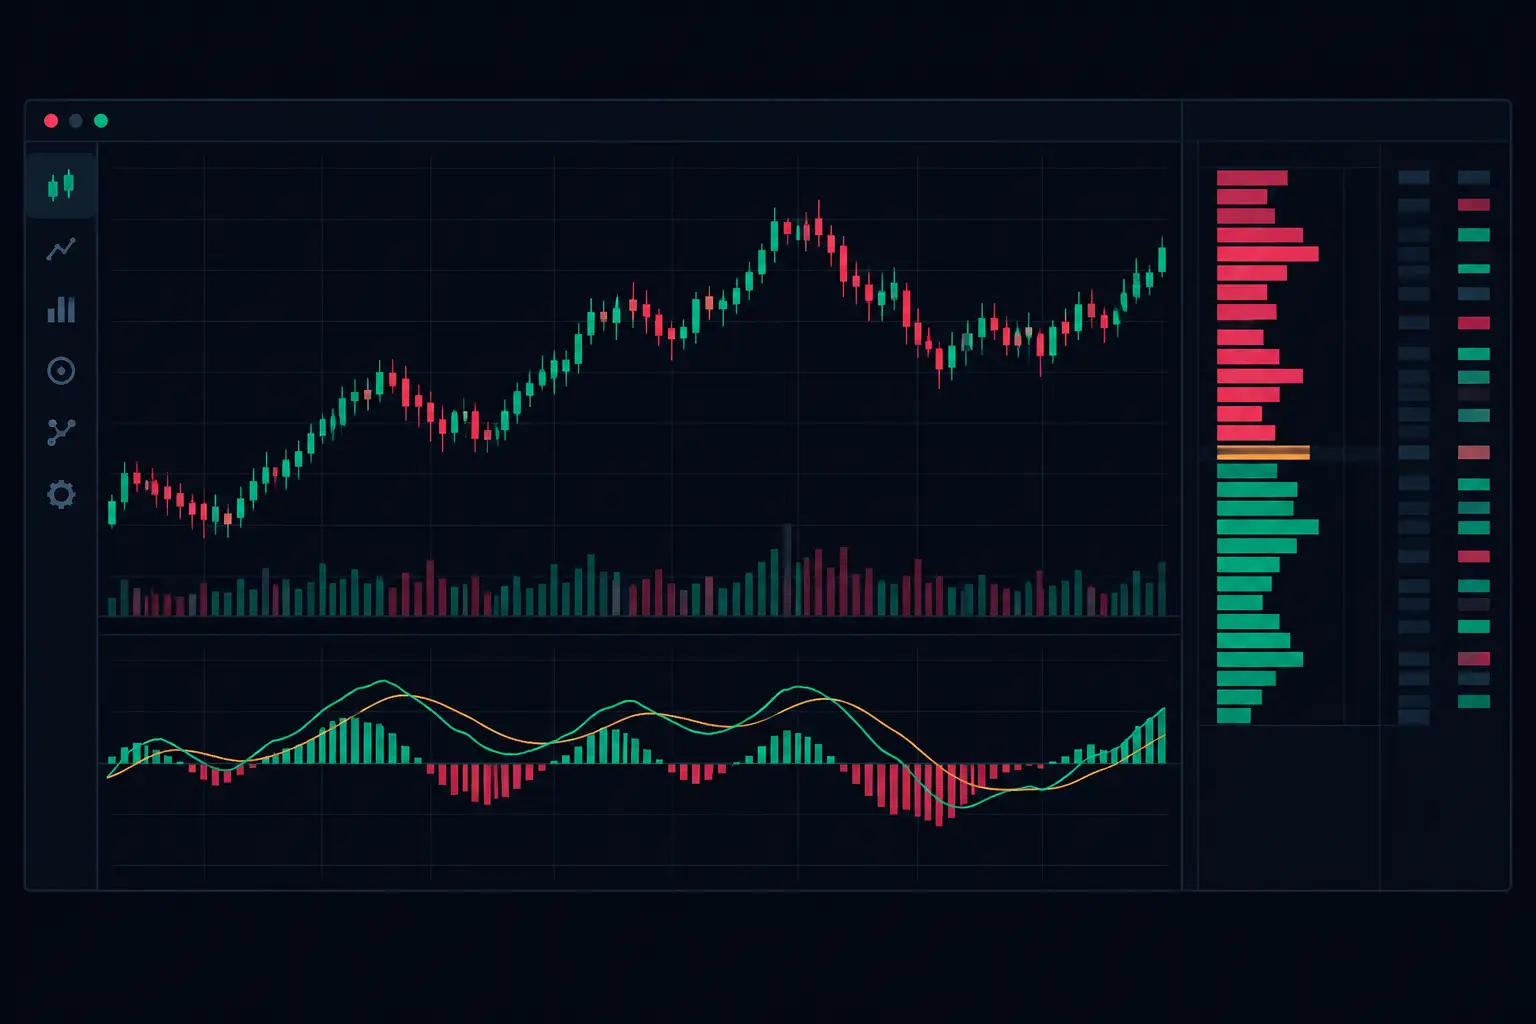
Delta Divergence Charts for Faster Auction Context
Delta divergence charts expose disagreement between price and aggressive volume, helping futures traders read absorption, exhaustion, and auction context.
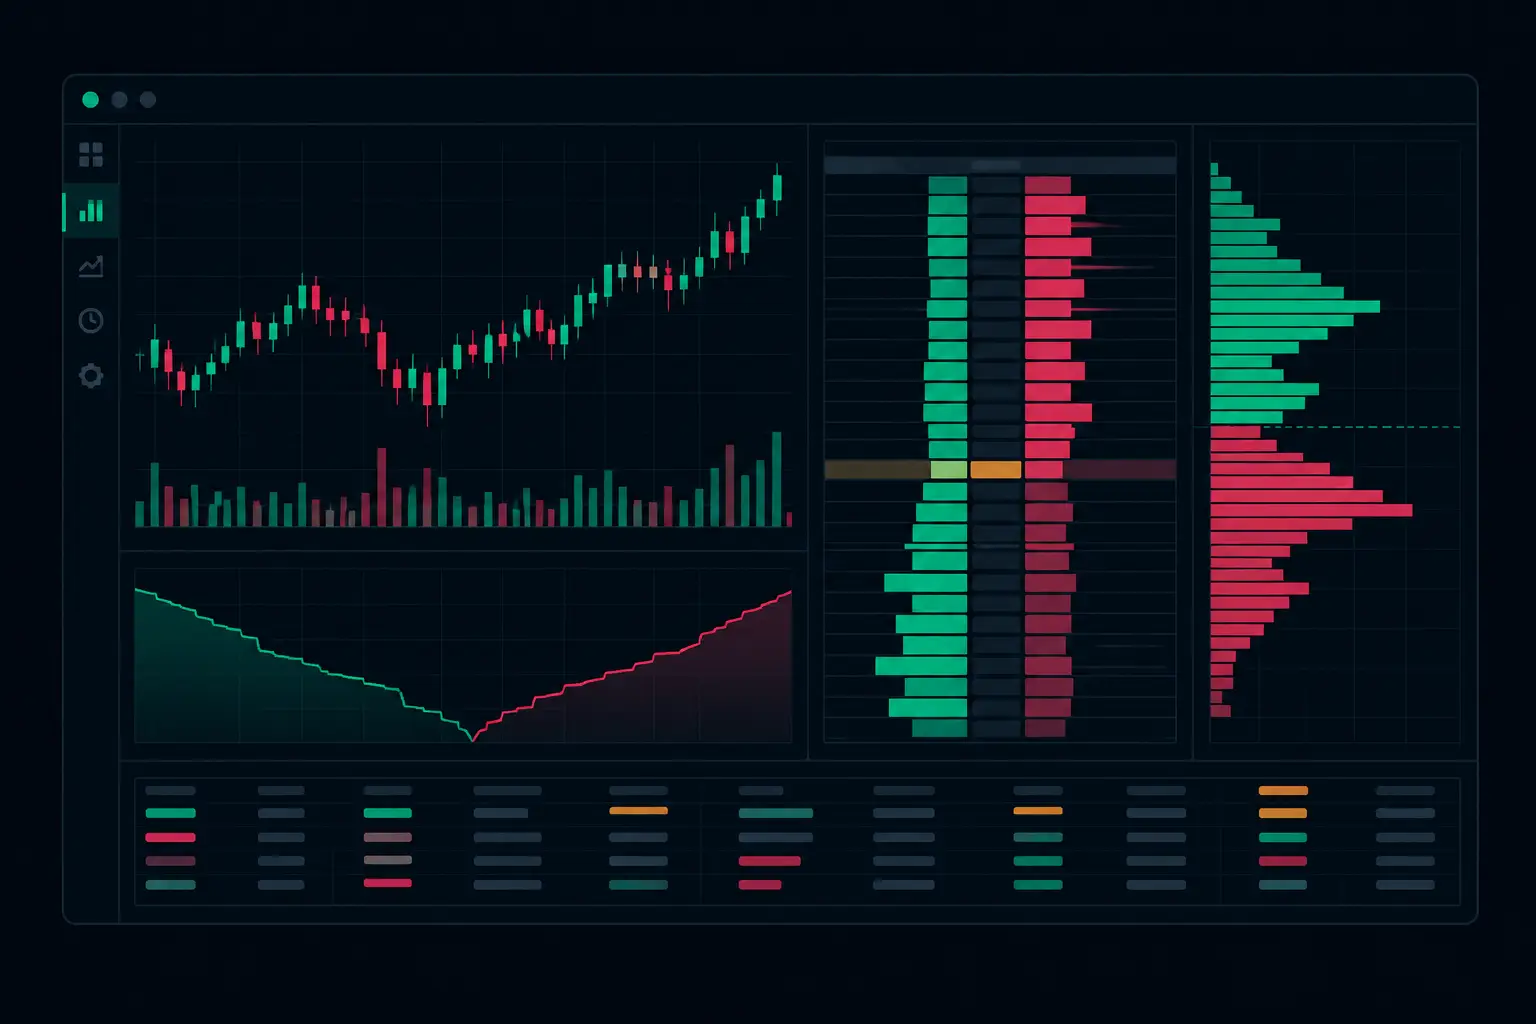
Futures Auction Analytics at Each Price Level
Futures auction analytics reveals the bid/ask interaction, delta, volume, and acceptance behind every developing futures auction in real time as it forms.